Home »
C programs »
graphics.h header file functions
Create a bar chart using graphics.h in C
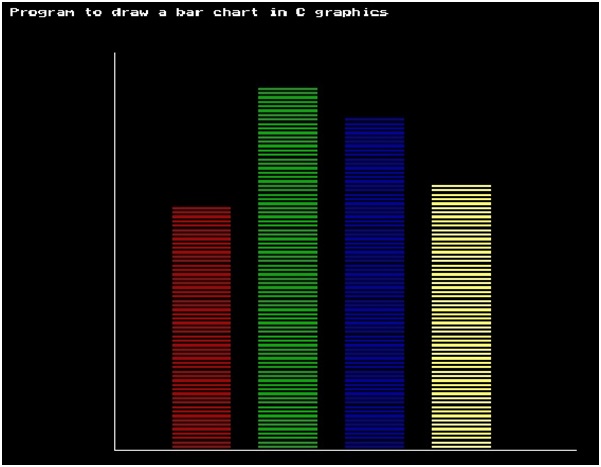
In this article, we are going to learn about the line(), bar() and setfillstyle() functions of graphics.h header file in C programming language to create bar chart.
Submitted by Manu Jemini, on March 18, 2018
Creating a bar chart in C with graphics.h library is very decent to show the result in a graphical form. To have a graph in your program first thing to do is to initialize a graph.
Second thing is, initialize X axis and Y axis of the graph. This can be done by calling the line function twice with the co-ordinate of the endpoints of both the axis.
The third step is to create bars. Now to create bars, you can easily choose a styling for the bar by calling the function setfillstyle(LINE_FILL, RED) before making the bar.
Fourth and the last step is to make the bar with four parameters which should be numbered. These numbers will be the co-ordinates of the bars.
These functions need the graphic.h file to be included in the program before using any of these functions.
graphics.h - line(), bar() and setfillstyle() functions Example in C
#include <graphics.h>
#include <conio.h>
#include <dos.h>
#include <stdlib.h>

void main() {
	//initilizing graphic driver and
	//graphic mode variable
	int graphicdriver=DETECT,graphicmode;

	//calling initgraph function with
	//certain parameters
	initgraph(&graphicdriver,&graphicmode,"c:\\turboc3\\bgi");

	//Printing message for user
	outtextxy(10, 10 + 10, "Program to draw a bar chart in C graphics");

	//initilizing lines for x and y axis
	line(100,420,100,60);
	line(100,420,500,420);

	//creating bars with certain filling style

	setfillstyle(LINE_FILL,RED);
	bar(150,200,200,419);

	setfillstyle(LINE_FILL,GREEN);
	bar(225,90,275,419);

	setfillstyle(LINE_FILL,BLUE);
	bar(300,120,350,419);

	setfillstyle(LINE_FILL,YELLOW);
	bar(375,180,425,419);

	getch();
}
Output
