Home »
Python »
Python Data Visualization
Python | Creative Wave Design in Matplotlib
In this article, we are going to create wave design using matplotlib in Python plotting.
Submitted by Anuj Singh, on August 21, 2020
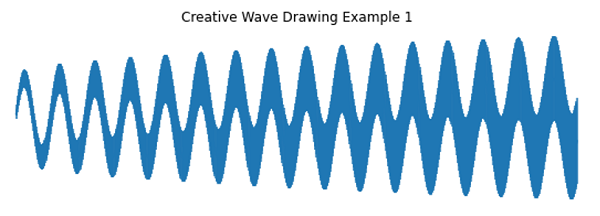
Apart from scientific and data plotting, python can be used for drawing creative designs with finer constructions. In this example, we have drawn wave designs (three examples) using the feature of plotting error bars in matplotlib. Errorbar helped us to plot waves with a consistent increase in width of waves which could be a problem designing this wave in other platforms. Since we are using mathematical functions at the core, it is very fine and definitive.
Illustrations:
Python code for creative wave design in matplotlib
import numpy as np
import matplotlib.pyplot as plt
x = np.arange(0.1, 100, 0.1)
y = np.sin(x)
y2 = 4+ np.cos(x+5)
yerr = 0.1 + 0.1 * np.sqrt(x)
plt.figure(figsize=(10,3))
plt.errorbar(x, y, yerr=yerr)
plt.axis(False)
plt.title('Creative Wave Drawing Example 1')
plt.show()
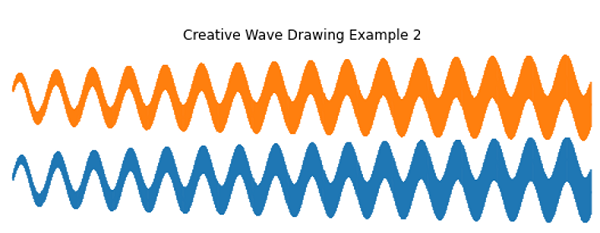
plt.figure(figsize=(10,3))
plt.errorbar(x, y, yerr=yerr)
plt.errorbar(x, y2, yerr=yerr)
plt.axis(False)
plt.title('Creative Wave Drawing Example 2')
plt.show()
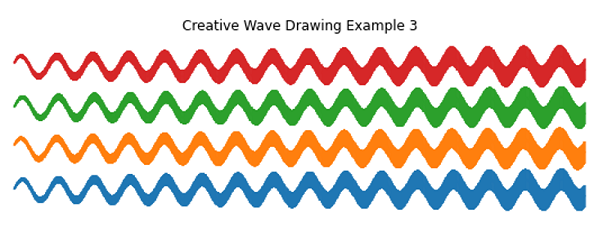
yy = 8 + np.sin(x)
y3 = 12 + np.cos(x+5)
plt.figure(figsize=(10,3))
plt.errorbar(x, y, yerr=yerr)
plt.errorbar(x, y2, yerr=yerr)
plt.errorbar(x, yy, yerr=yerr)
plt.errorbar(x, y3, yerr=yerr)
plt.axis(False)
plt.title('Creative Wave Drawing Example 3')
plt.show()
Output:
Output is as Figure
Advertisement
Advertisement