Home »
Python »
Python Data Visualization
Python | Coloring Each Plot in Bar Plot
In this tutorial, we are going to learn how to color individual bars with different colors in a bar plot?
Submitted by Anuj Singh, on August 05, 2020
It is rarely used but, in some cases where we need to color different categories with different colors then we can use this property of matplotlib. The following example shows us how to implement colored bars in python using matplotlib.
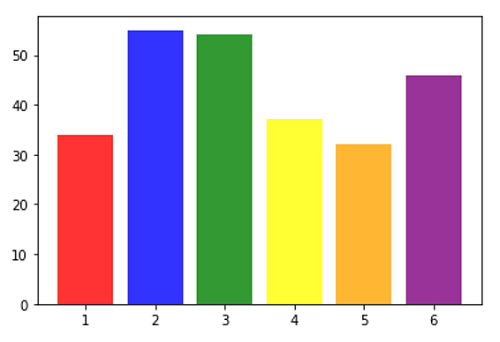
Illustration:
Python code for coloring each plot in bar plot
import matplotlib.pyplot as plt

x = [1,2,3,4,5,6]
y = [34, 55, 54, 37, 32, 46]

col = ['red', 'blue', 'green', 'yellow', 'orange', 'purple']

plt.figure()
plt.bar(x, y, color=col, alpha=0.8)
Output:
Output is as figure