Home »
Articles
Efficient Debugging in Python: Using Built-in Tools and External Debuggers
Last updated : April 06, 2025
Debugging isn't glamorous. It doesn't grab headlines like shiny new frameworks or AI libraries. But when your Python script crashes five minutes before a deadline, debugging quickly becomes the only thing that matters.
Whether you're fixing a small function or untangling a spaghetti mess of microservices, the key is using the right tools—and knowing when and why to use them. Python offers a solid set of built-in and external debuggers that can seriously cut down your stress and save time.
Let's break it down.
Section 1: Start with Python's Built-in Debugger (pdb)
What is pdb?
pdb stands for Python Debugger. It's included with every Python installation and works straight from the command line. You can pause execution, inspect variables, step through code, and figure out where things go off the rails.
Why use it?
- No setup required
- Works even in minimal environments (like a remote server)
- Fast and effective for isolated issues
Real-world scenario
Imagine this: You're working on a script that calculates prices after tax and discounts. It's throwing incorrect totals, but the logic seems fine at a glance.
import pdb

def final_price(price, tax, discount):
    pdb.set_trace()
    taxed = price + (price * tax)
    return taxed - (taxed * discount)

print(final_price(100, 0.1, 0.2))
When you run this script, Python stops at set_trace(), giving you a live environment to check each step. You might discover that you applied the discount after tax (instead of before) and need to adjust your formula.
Common pdb commands
| Command |
Purpose |
| n |
Go to the next line |
| p x |
Print the value of variable x |
| b 10 |
Set a breakpoint at line 10 |
| c |
Continue execution |
| s |
Step into a function |
| q |
Quit debugger |
Section 2: Use %debug in Jupyter or IPython for Quick Fixes
What is %debug?
This one's for folks using Jupyter notebooks or IPython shells. When a cell fails, you can type %debug right after and it drops you into post-mortem mode, showing exactly where things went wrong.
Why use it?
- Super quick feedback loop
- Great for data science, teaching, or exploratory coding
- No need to re-run the script or set breakpoints
Real-world scenario
Let's say you're doing data wrangling and hit a divide-by-zero error:
def normalize(score, max_score):
    return score / max_score

normalize(10, 0)
Once the error pops up, just run %debug. You can check variable values and traceback without touching anything else.
Section 3: External Debuggers That Actually Save Time
1. VS Code Debugger – Your First Choice for Visual Debugging
If you use Visual Studio Code (and let's be real—most people do), its built-in debugger is a game-changer. You don't have to write set_trace() or anything. Just click and go.
Why use it?
- Clean UI with breakpoints and variable watchers
- Works with Django, Flask, FastAPI, and more
- Perfect for testing asynchronous code and unit tests
Real-world scenario
You're building a Flask API, but a POST request isn't behaving the way it should. Instead of throwing in random print statements, set a breakpoint in views.py, send the request, and watch how each line executes and how values change.
Bonus: You can right-click a test function and hit "Debug Test" to walk through unit test failures step by step.
2. PyCharm Debugger – Power Tool for Bigger Projects
PyCharm's debugger has more bells and whistles. If you're managing a complex app with background tasks or remote environments, this one's got your back.
Why use it?
- Supports remote debugging (SSH or Docker containers)
- Conditional breakpoints (e.g., only break if x > 10)
- Integrates directly with web frameworks and test runners
Real-world scenario
You're dealing with a Django app that randomly fails during checkout. The issue only occurs when the cart has a specific number of items. Set a conditional breakpoint: if cart.total_items == 5. PyCharm will stop only when that condition is met—no extra noise.
3. pudb – A Visual Debugger in the Terminal
Don't want an IDE? Working on a remote server? pudb brings a visual debugger to your terminal.
pip install pudb
python -m pudb my_script.py
Why use it?
- Cleaner interface than pdb
- See the call stack, local variables, and your code all at once
- Handy when working over SSH or on headless machines
While you're streamlining your debugging, don't forget about tools that can supercharge your development in other ways.
This Resource Page compiles the top rated AI libraries for Python Development—ideal if you're building smarter, faster Python applications alongside your debugging workflows
Section 4: Debugging Habits That Make Life Easier
Tools help. But your approach matters too. Here are a few habits worth building.
1. Use Logging Instead of print()
Print is fine for quick stuff. But logging lets you track issues across modules and filter by importance.
import logging

logging.basicConfig(level=logging.DEBUG)
logging.debug("Total after discount: %s", total)
Logging also works great with external services or when tracing bugs in production.
2. Reproduce the Bug in Isolation
If you're not sure where the bug lives, strip your code down. Create a minimal version of the problem. This “rubber duck debugging” approach works because it forces you to explain your logic step by step—even if only to yourself.
3. Watch for Indexing and Off-by-One Errors
It's always the for-loops, isn't it?
for i in range(len(my_list)):
    print(my_list[i + 1])  # Whoops!
Carefully check range boundaries, especially when slicing arrays or accessing list items.
4. Double-Check External APIs and Dependencies
Sometimes, the issue isn't your code. A broken API, a bad version of a library, or a subtle change in response format can throw everything off. Try mocking the response or using a static file to see if the bug persists.
Bonus: Debugging Asynchronous Python
Async functions don't always follow the top-down order we're used to. That can make bugs weirdly inconsistent or hard to reproduce.
Quick tips:
- Use breakpoints directly inside
async functions (VS Code and PyCharm handle this well)
- Use
run() to simplify coroutine execution
- Check for missing
await calls or silent exceptions
Example
import asyncio

async def fetch_data():
    await asyncio.sleep(1)
    return 42

async def main():
    result = await fetch_data()
    print(result)

asyncio.run(main())
Missing an await or misplacing async can lead to silent failures or coroutine warnings. Debuggers help you trace through the event loop cleanly.
While mastering debugging is essential, expanding your Python skillset with AI tools can open new doors. Visit our Machine Learning and AI tutorial page to explore top-rated libraries and hands-on examples.
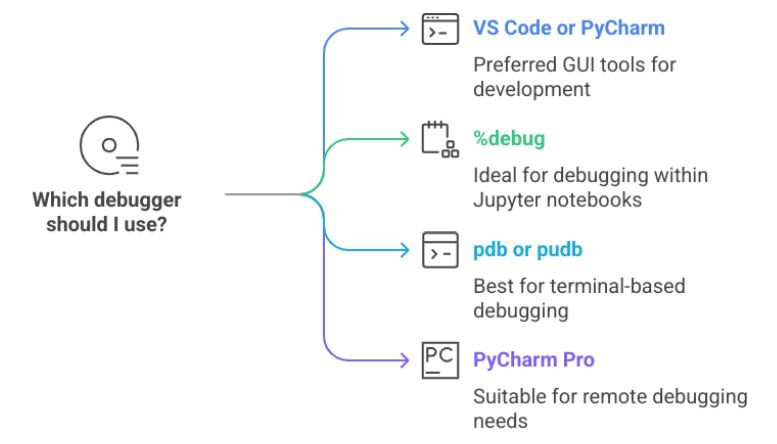
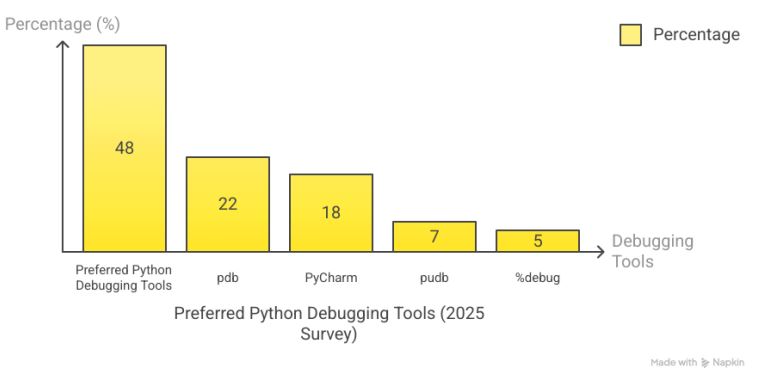
Which Debugger Should You Use?

"Preferred Python Debugging Tools (2025 Survey)"

Source: Code B
Final Thoughts
Debugging in Python doesn't have to feel like an endless scavenger hunt. Whether you're editing a small script or working on a team with large-scale software, using the right tool at the right time is the fastest way to stay sane and ship working code.
Remember:
- Pick a tool that fits your workflow
- Keep your debugging focused and simple
- Don't be afraid to step away and come back with fresh eyes
Advertisement
Advertisement