Home »
Articles
How to Excel: A Step-by-Step Guide to Mastering Microsoft Excel
By Aman Rathore Last updated : October 20, 2023
Microsoft Excel is a spreadsheet application favoured by people around the world. It is a powerful tool with Excel formulas, Excel functions and Excel Pivot Tables, along with other useful features. Ms Excel is handy for data analysis, visualization, and reporting. Excel finds uses in various industries, including finance, accounting, marketing, sales, operations, and human resources.
Edulyte is also a helpful resource for Excel learning. It offers impressive courses on various Excel topics, from beginner to advanced. Edulyte's courses are engaging and interactive, offering multiple features to help you learn. There is a huge repository of learning resources including quizzes, exercises, and real-world projects for learners. All you have to do is Register for Free!
Introduction: Importance of Excel for Your Career
Microsoft Excel is essential in various industries because it is a versatile tool that can be used for a wide range of tasks. Here are some examples:
- Finance and accounting: Excel formulas and functions are used to prepare financial statements, track budgets, and analyse financial data.
- Marketing: Excel chats and tables tracks sales data, creates marketing reports, and manages customer relationships.
- Sales: Excel tracks sales leads, designs sales proposals, and drives sales pipelines.
- Operations: Excel tracks inventory, manages production schedules, and monitors performance metrics.
- Human resources: Excel tracks employee data, manages payroll, and generates HR reports.
The Practicality of Learning Excel
Learning Excel is a practical skill used in various jobs and industries. It is a skill that is in high demand by employers. Excel skills can help you to be more efficient and productive in your work.
Here are some of the benefits of learning Excel:
- Increased job opportunities: Excel skills are in high demand by employers. Learning Excel can make you more competitive in the job market.
- Improved productivity: Excel can help you to be more efficient and productive in your work. You can finish all your tedious tasks with minimum effort.
- Career advancement: Excel skills can help you to advance in your career. Many employers look for Excel skills in your resume.
Getting Started with Excel
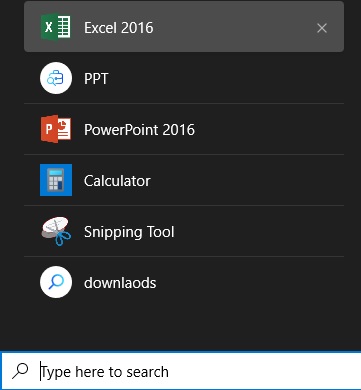
To launch Excel, click the Excel icon in your Start menu or desktop. You can download Excel from the Microsoft website if you still need to install Excel on your computer.
Once Excel launches, you will be prompted to create a new workbook. A workbook is a file that contains one or more spreadsheets. To create a new workbook, click on the "Blank workbook" template.
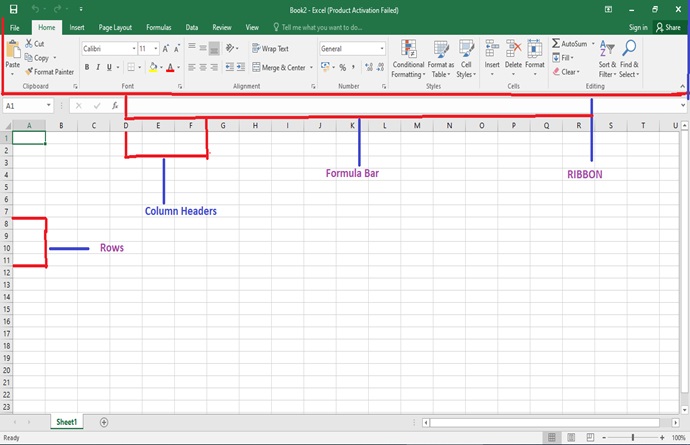
Excel Interface and Components
The Excel interface is divided into the following components:
- Ribbon: The ribbon is at the top of the Excel window and contains all Excel commands.
- Formula bar: The formula bar is located below the ribbon and is used to enter and edit formulas.
- Cell grid: The cell grid is the main area of the Excel window and is where you enter and edit data.
- Column headers: The column headers are located at the top of the cell grid and identify each column.
- Row headers: The row headers are located on the left side of the cell grid and identify each row.
Customising Excel Settings
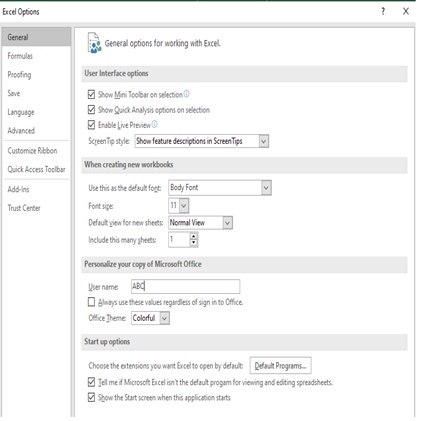
To customise Excel settings, click the "File" tab and "Options". In the Options window, you can customise various settings, such as the ribbon display, the keyboard shortcuts, and the calculation options.
Tips for Getting Started with Excel
Here are some tips for getting started with Excel:
- Start with the basics: Learn the fundamentals of Excel, such as how to enter and edit data, employ formulas, create charts and graphs.
- Use the ribbon: The ribbon is a powerful tool that can help you find and use Excel commands quickly and easily.
- Use the formula bar: The formula bar facilitates entering and editing formulas. To enter a formula, start typing in the formula bar, and Excel will suggest formulas as you type.
- Use the cell grid: The cell grid is the main area of the Excel window and is where you enter and edit data. To enter data into a cell, click on the cell and start typing.
- Use the column and row headers: The column and row headers can navigate the cell grid quickly and easily. Click on the corresponding column or row header to select a column or row.
- Customise Excel settings: Customise Excel settings to suit your preferences. It will make you more efficient and productive at your workplace.
Entering and Formatting Data
To enter data into an Excel cell, click on the cell and start typing. You can enter any data into a cell, such as text, numbers, dates, and times.
To enter a formula into a cell, type an equal sign (=). A list of available functions will appear. Select the function you want to use and enter the required arguments.
Once you have entered data into a cell, press Enter to move to the next cell. You can also use the arrow keys to move around the cell grid.
Essential Formatting Options
Excel offers a variety of formatting options that you can use to customise the appearance of your data. Some essential formatting options include:
-
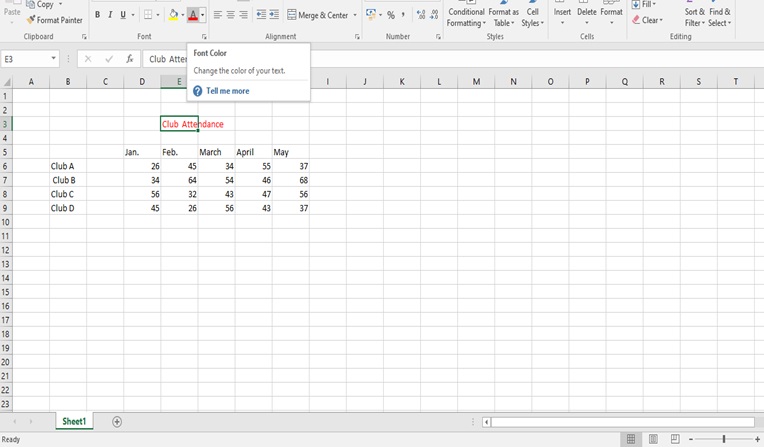
Font styles: You can change your data's font style, size, and colour.
-
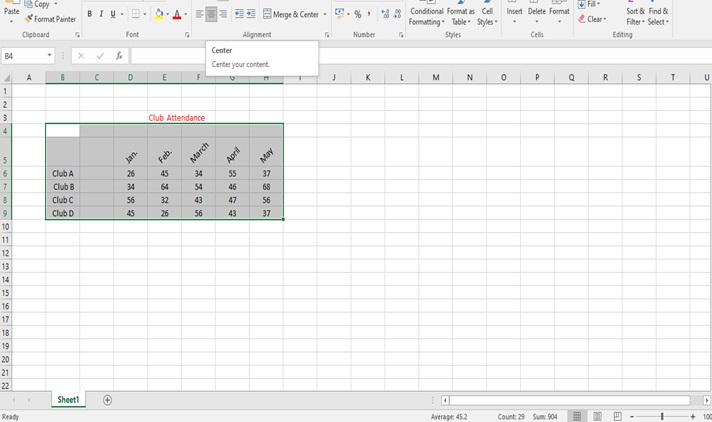
Cell alignment: You can align your data horizontally or vertically within a cell. You can also centre your data within a cell.
-
Borders: You can add borders to cells to separate them from each other or to group them.
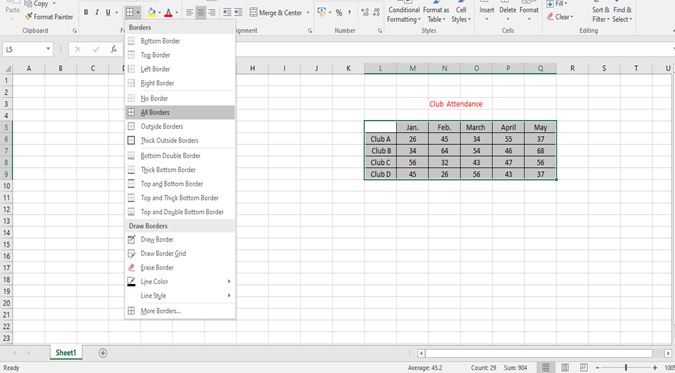
To apply formatting to a cell, click on the cell and then select the desired formatting option from the ribbon. You can also apply formatting to multiple cells by selecting the cells and then applying the formatting option.
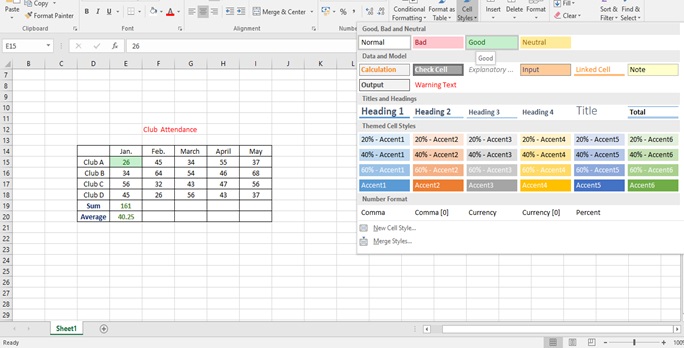
Using Cell Styles and Themes for Consistent Formatting
Cell styles and themes can apply consistent formatting to your data.
- Select the cells you want to format to create a cell style, and then click the " Cell Style" button in the ribbon.
- In the " Cell Style" window, you can customise the formatting options for the cell style.
- To apply a cell style to a cell or group of cells, select the cells and then click on the cell style in the ribbon.
- To apply a theme to your workbook, click the "Design" tab and select a theme from the "Themes" gallery.
Formulas and Functions Demystified
Formulas are expressions that perform calculations on data in Excel. Functions are predefined formulas that perform specific calculations. For example, the SUM function adds up the values in a range of cells.
How do formulas work?
- To create a formula, type an equal sign (=).
- Then, you enter the function or expression that you want to use.
- For example, to add up the values in cells A1 to A5, you should type the following formula: =SUM(A1:A5)
Excel will then calculate the result of the formula and display it in the cell where you entered the formula.
Examples of basic functions
Here are some examples of basic functions in Excel:
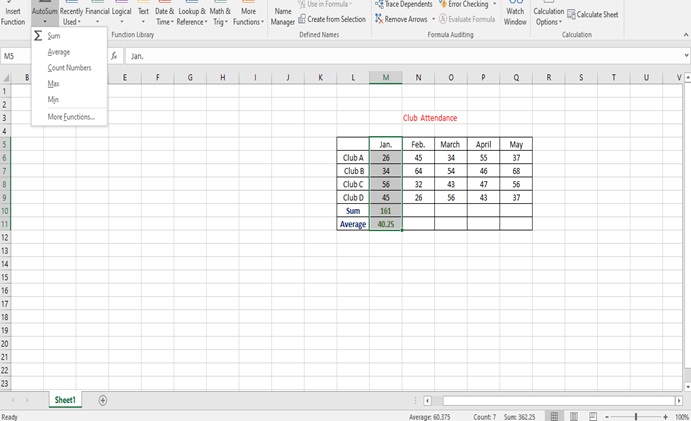
- SUM: Adds up the data or values in the selected range of cells.
- AVERAGE: As the name suggests, the Average function determines the average values in the selected range of cells.
- COUNT: It counts the number of cells in a selected range of numbers.
- MAX: Locates the largest value in the selected range of cells.
- MIN: Lacates the smallest value in the selected range of cells.
Absolute and relative references
- When you use a cell reference in a formula, you can specify whether the reference is absolute or relative.
- An absolute reference refers to the same cell, even if you copy the formula to another cell.
- A relative reference refers to a cell relative to the cell where the formula is located.
- To specify an absolute reference, place a dollar sign ($) before the column letter and row number. For example, the following formula uses an absolute reference to cell A1: =$A1
- If you copy this formula to another cell, the formula will still refer to cell A1.
- To specify a relative reference, omit the dollar signs. For example, the following formula uses a relative reference to cell A1: =A1
- If you copy this formula to another cell, the formula will refer to the cell that is one row above and one column to the left of the cell where you copied the formula.
Using formulas and functions in Excel
Formulas and functions perform a wide range of tasks in Excel. For example, you can use formulas to calculate discounts, calculate sales tax, and create financial models. You can also use functions to manipulate text data, perform logical tests, and convert data from one format to another.
Tips for using formulas and functions
Here are some tips for manipulating formulas and functions in Excel:
- Start with the basics: Learn the basics of Excel formulas and functions, such as how to enter formulas, how to use cell references, and how to use essential functions like SUM and AVERAGE.
- Use the formula bar: The formula bar is a powerful tool that can help you to enter and edit formulas. To display the formula bar, press F2.
- Use the function library: The function library is a list of all of the available Excel functions. Click the "Insert Function" button in the ribbon to access the function library.
- Use Help: If you need help with a formula or function, use Excel's Help system. To access Excel's Help system, press F1.
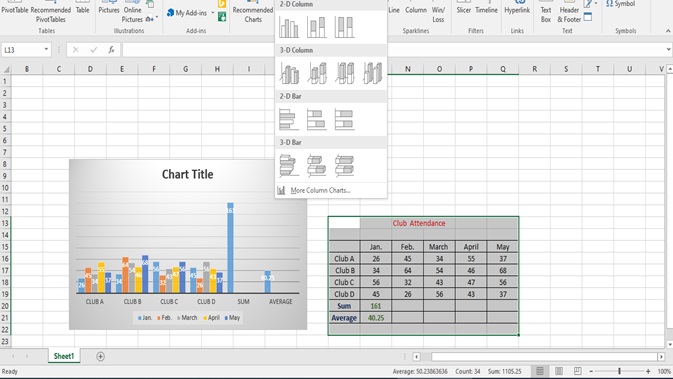
Creating Impressive Charts and Graphs
Charts and graphs are effective ways to visualise data and communicate insights. Excel offers a variety of chart and graph types that can represent different data types.
Types of charts and graphs
Here are some common types of charts and graphs:
- Bar graphs: Bar graphs can compare different categories of data. For example, you could use a bar graph to compare sales figures for other products or regions.
- Line charts: Line charts can show how data changes over time. For example, you could use a line chart to show how stock prices have changed over the past year.
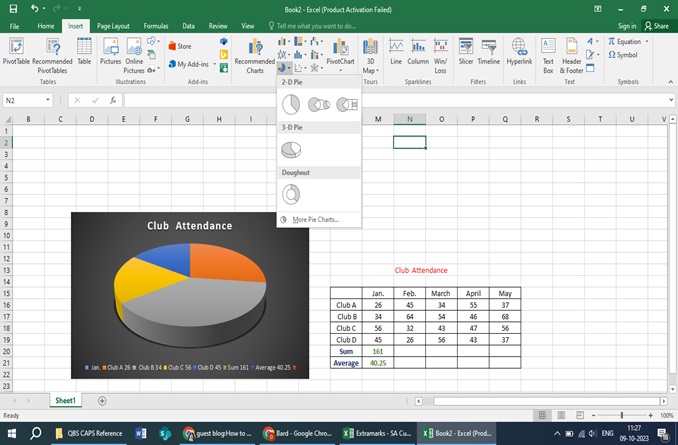
- Pie charts: Pie charts can show the proportion of different categories of data. For example, you could use a pie chart to show the percentage of market share for various companies.
Choosing the right chart type
When choosing a chart type, it is essential to consider the kind of data you visualise and the message you want to communicate. For example, if you are comparing different categories of data, a bar graph would be a good choice. A line chart would be a good choice if you show how data changes over time. A pie chart would be a good choice if you show the proportion of different categories of data as a whole.
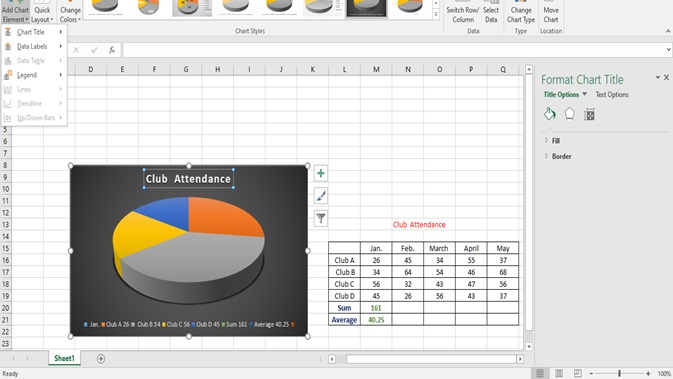
Enhancing charts with titles, labels, and formatting
Once you have created a chart, you can improve it with titles, labels, and formatting to make it more informative and visually appealing.
- To change or add the title of your chart, click on the title and select the Chart title from the Add Chart elements on the Ribbon.
- You can carry out other changes, including Data Label and Legends.
- To add labels to your chart, you only have to click on the chart and then select the data series you want to label.
- Then, click the "Add Data Labels" button in the ribbon.
You can use the different options on the ribbon to format your chart. For example, you can change the chart elements' font, colour, and size. You can also add borders, shadows, and other effects.
Tips for creating impressive charts and graphs
Here are some tips for creating remarkable charts and graphs:
- Choose the right chart type for your data.
- Use clear and concise titles and labels.
- Use consistent formatting throughout your chart.
- Use data colours that are easy to distinguish.
- Avoid cluttering your chart with too much information.
- Highlight critical data points.
- Use a legend to explain the different data series in your chart.
Advanced Excel Techniques
Excel performs various tasks, from simple data entry to complex financial analysis. In addition to the essential features that most people are familiar with, Excel offers several advanced features that can help you take your work to the next level.
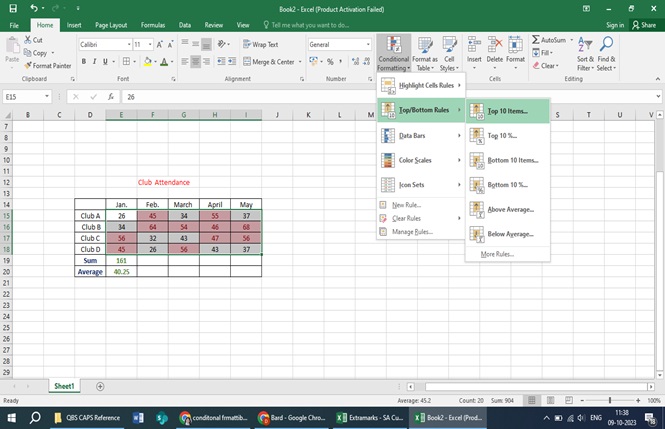
Conditional Formatting
Conditional formatting allows for applying different formatting to cells based on their values. It can create visually appealing and informative spreadsheets. For example, you could use conditional formatting to highlight cells that contain errors, colour-code sales data, or show data trends.
Data Consolidation
Data consolidation assists you to bring together data from different worksheets or workbooks into a single worksheet. It can create anything, from monthly sales reports to consolidating budget data from different departments.
Advanced Formulas
Excel offers a wide range of advanced formulas that can perform complex calculations. For example, you can use formulas to calculate loan payments, to forecast future sales, or to perform statistical analysis.
What-If Analysis
Excel's What-If Analysis tools allow you to experiment with different scenarios to see how they would affect your data. It can be helpful in tasks such as financial planning or risk assessment.
Macros
Macros automate repetitive tasks in Excel. By recording a macro, you can capture the steps involved in a task and then run the macro to perform the task automatically. It can save you time and effort, primarily if you perform the same tasks regularly.
Benefits of Using Advanced Excel Techniques
There are several benefits to using advanced Excel techniques:
- Increased efficiency: Advanced Excel techniques can help you to be more efficient in your work by automating tasks and streamlining processes.
- Improved accuracy: Advanced Excel techniques can help you prove your work's accuracy by reducing the risk of human error.
- Greater insights: Advanced Excel techniques can help you gain more significant insights into your data by allowing you to perform complex calculations and visualisations.
- More professional results: Using advanced Excel techniques can help you create more professional-looking spreadsheets and rep
Excel Tips and Tricks
Excel is a powerful tool that offers you many functions. But it can also be complex and time-consuming to learn. Here are some tips and tricks to help you save time, improve your accuracy, and get the most out of Excel:
Time-saving shortcuts
- Keyboard shortcuts: For Excel, there are several keyboard shortcuts. They can save you time and effort. For example, use the Ctrl+C keys to copy your data. The Ctrl+X keys enable you to take your data from one place and paste it into another area on the sheet. Use the F4 shortcut to repeat the last action you performed.
- AutoFill: It allows you to populate a range of cells with a data sequence automatically. To use AutoFill, enter the first few terms in the sequence and then drag the fill handle. Depending on how you have filled your data, it can be dragged down the column or across the row.
- Templates: Excel offers a variety of templates that you can use to create spreadsheets quickly and easily. To access the templates, click the "File" tab and select "New". In the "New" window, click on the "Templates" tab and select the required one.
Lesser-known Excel tricks
- Flash Fill: Flash Fill is a feature that can automatically populate a range of cells with data based on patterns in existing data. To use Flash Fill, enter the first few results in the desired column and click the "Flash Fill" button in the ribbon.
- Conditional formatting: Conditional formatting is a feature through which you can apply different types of formatting to cells based on their values. It can create visually appealing and informative spreadsheets. For example, you could use conditional formatting to highlight cells that contain errors, colour-code sales data, or show data trends.
- Pivot tables: These are an empowering tool for summarising and analysing data. To create a pivot table, select the data you want to analyse and then click the "Insert PivotTable" button in the ribbon. In the "Insert PivotTable" window, select where you want to place the pivot table and click "OK".
Efficient error handling and troubleshooting
- Error checking: Excel has a built-in error-checking feature that can help you to identify errors in your spreadsheets. To run the error check, click the "Formulas" tab and the "Error Checking" button in the ribbon.
- Error messages: When Excel encounters an error, it will display an error message in the formula bar. The error message will provide information about the error and how to fix it.
- Help system: Excel's Help system is a valuable resource for troubleshooting errors. To access the Help system, press F1 on your keyboard.
Explore Excel's hidden gems
Excel has several features that are hidden from view by default.
- You must get to the Developer tab to access these hidden features. To reach the Developer tab, click the "File" tab and select "Options".
- In the "Excel Options" window, click on the "Customise Ribbon" tab and then check the box next to "Developer" in the "Main Tabs" list.
- You can employ several hidden features via the Developer tab, such as the Visual Basic Editor (VBE), the Macro Recorder, and the Form Designer.
- These features automate tasks, create custom functions, and develop user interfaces.
Excel Resources for Further Learning
Several valuable resources are available to help you learn more about Excel. Here are a few recommendations:
Books
- Excel 2023 for Dummies by Greg Harvey
- Excel Dashboards and Reports: A Complete Guide for Creating Effective and Insightful Dashboards by John Walkenbach
- Excel Data Analysis and Modeling: A Complete Guide for Business Analysts and Power Users by Greg Harvey
Courses
- Excel Courses by Edulyte
- Microsoft Excel Training Course by edX
- Excel Bootcamp by Udemy
- Excel Mastery: From Beginner to Advanced by Coursera
Websites
Conclusion
Microsoft Excel is a powerful tool for many tasks. You can increase your efficiency and productivity by learning the basics of Excel, such as how to enter and edit data, employ formulas, and create charts and graphs.
Here are some key takeaways from the guide:
- Excel is a powerful tool for various tasks, including data entry, analysis, and visualisation.
- Learning Excel is a practical skill that can help you to be more efficient and productive in your work.
- Excel offers a variety of features that can help you create professional-looking spreadsheets and reports.
- Several valuable resources are available to help you learn more about Excel, including books, courses, and websites.
Advertisement
Advertisement