Home »
Articles
Top Infrastructure Monitoring Tools for Developers in 2026
Last updated : July 31, 2026

A developer's workstation showing live metrics from servers and containers across several dashboards
Infrastructure has gotten a lot more complicated for the average developer. It's not just servers anymore, it's containers, microservices, hybrid cloud, and a dozen small services talking to each other at once. Somewhere along the way, understanding monitoring stopped being an ops-team problem and became something every backend developer is expected to know at least a little about.
That expectation is showing up in the numbers. 85% of DevOps teams now run more than one monitoring tool at the same time, and only 14% say they're happy with their mean time to resolution, according to a DevOps statistics roundup published by Spacelift. Tool sprawl and alert fatigue are real, and picking the wrong monitoring stack early on tends to compound that problem rather than fix it. This list walks through ten tools developers are likely to run into on the job, starting with the one that's easiest to get running today.
What to look for when choosing an infrastructure monitoring tool
Before ranking anything, it helps to know what actually matters when you're the one setting the tool up, not just the one reading the dashboard afterward.
A few criteria stand out for developers specifically, rather than for enterprise procurement teams:
- Resource footprint: how much CPU and RAM the monitoring agent itself eats up on the machine it's watching
- Setup time: whether you get useful data in minutes with auto-discovery, or whether you're writing instrumentation code first
- Open source versus commercial: whether you can self-host for free or you're locked into a subscription from day one
- Cost at small scale: what it costs to run this on a side project or a five-person team, not a 5,000-node fleet
- Metric granularity: real-time, per-second data versus sampled averages that can hide short spikes
- Alerting and anomaly detection: whether the tool tells you something is wrong before a user does
- Learning curve: how much time you'll spend reading docs before the tool is actually useful
Kubernetes adoption is also reshaping this list. Production Kubernetes use reached 82% among container users in 2025, and OpenTelemetry is now the second-highest-velocity project inside the CNCF, with more than 24,000 contributors, according to the CNCF Annual Cloud Native Survey 2025. Any tool you pick today needs to play well with that ecosystem, or you'll be fighting it within a year.
1. Netdata
Netdata is usually the fastest way for a developer to go from “I have no visibility into this server” to “I have per-second metrics on everything,” which is why plenty of teams consider it the best infrastructure monitoring tool for getting started without a dedicated platform team on hand.
Install it and it auto-discovers what's running on the box, no manual instrumentation required. It collects metrics every second rather than sampling every 30 or 60 seconds, which matters when a short-lived spike caused your incident. Netdata claims its agent runs on roughly 5% CPU and 150MB of RAM per node, noticeably lighter than heavier agent-based platforms. There are more than 800 integrations, an open-source core with over 76,000 GitHub stars, and built-in AI-powered anomaly detection that flags unusual behavior without writing a single alerting rule. Pricing is flat per node rather than per gigabyte ingested, and your raw data stays on your own infrastructure, with only metadata sent to the cloud layer. For a solo developer testing this on a home lab or a small team monitoring a handful of production servers, that combination of zero-config setup and low overhead is hard to beat.
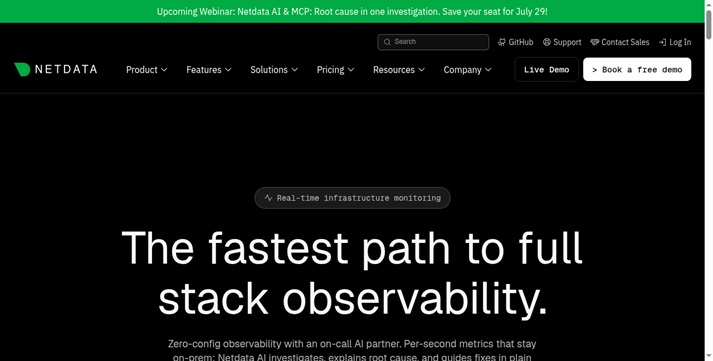
Netdata's website
2. Prometheus
Prometheus is the default choice for anyone running Kubernetes. It's open source, pull-based, and built around PromQL, its own query language for aggregating time-series data. Native Kubernetes service discovery means it's usually the first thing installed on a new cluster, and industry analysis from Last9 puts Prometheus usage at over 80% of Kubernetes clusters for metrics collection. The global observability tools and platforms market was valued near $2.9 to $3.5 billion in 2025 and is projected to keep growing through the early 2030s, according to Grand View Research, which partly explains why so many tools compete for this space.
The tradeoff is that Prometheus is metrics-only. There's no built-in logging or tracing, and long-term storage at scale usually means bolting on Thanos or Cortex, which adds real operational overhead of its own.
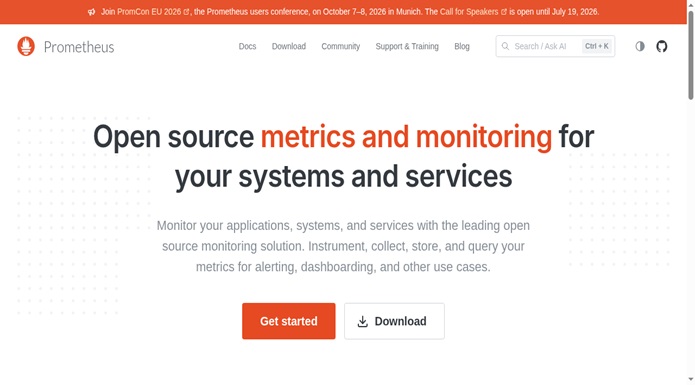
Prometheus's metrics and query interface
3. Grafana
Grafana handles the visualization and alerting side that Prometheus doesn't. Most Prometheus deployments pair it with Grafana for dashboards, plus Loki for logs and Tempo for traces, forming a common open-source observability stack. Grafana's strength is correlation: jumping between metrics, logs, and traces from one screen instead of three separate tools.
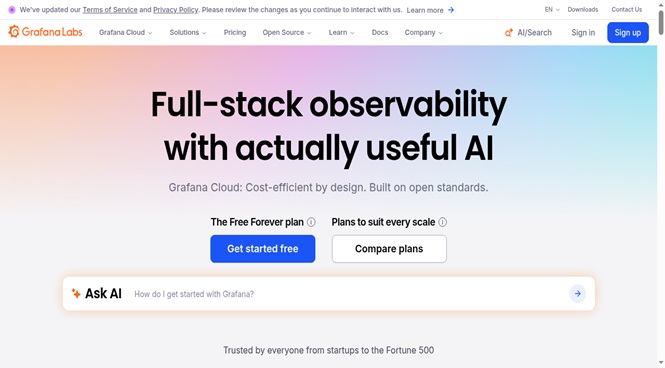
Grafana's dashboard and visualization layer
4. Zabbix
Zabbix covers almost anything you'd want to monitor: servers, VMs, containers, databases, and network devices, using both agent-based and agentless methods like SNMP, IPMI, and SSH. It scales to tens of thousands of devices without much trouble. The catch is complexity. Configuring Zabbix well in a large, mixed environment takes real time, and it's not the tool for metrics in the next five minutes.
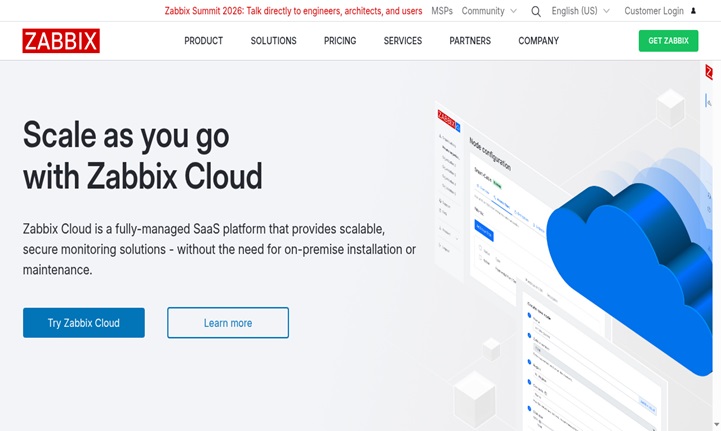
Zabbix's network and infrastructure monitoring console
5. Datadog
Datadog is a fully managed SaaS platform bundling APM, infrastructure monitoring, and log management into one product. For a small team without a dedicated platform engineer, that convenience is genuinely valuable, since there's nothing to self-host or patch. The downside shows up on the invoice: per-host and per-gigabyte pricing means costs can climb from a couple hundred dollars a month to several thousand as usage grows.
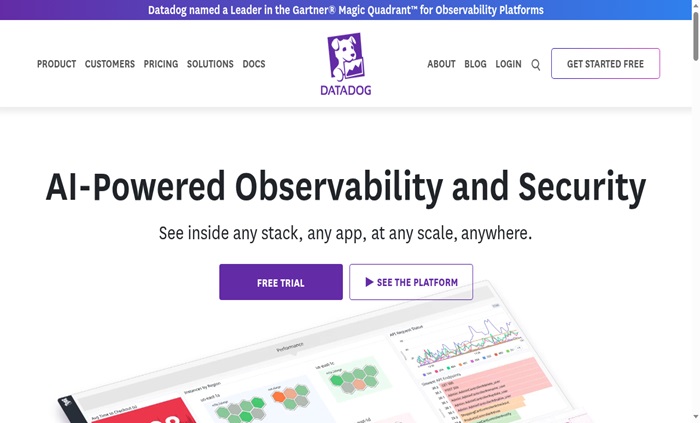
Datadog's unified observability platform interface
6. New Relic
New Relic covers a similarly broad surface: APM, infrastructure, logs, and browser and mobile monitoring, all under one vendor. Pricing is consumption-based rather than per-host, which some teams find easier to predict. It's a solid pick for teams wanting a single vendor across the entire stack rather than stitching together specialized tools.
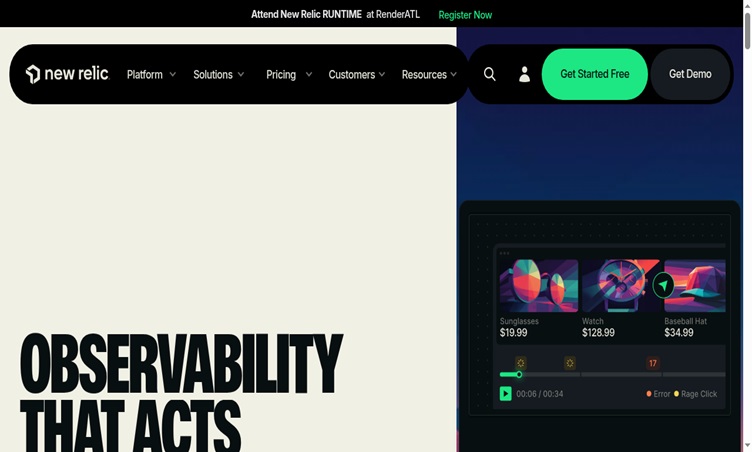
Dynatrace's AI-driven root-cause analysis engine, Davis AI
7. Dynatrace
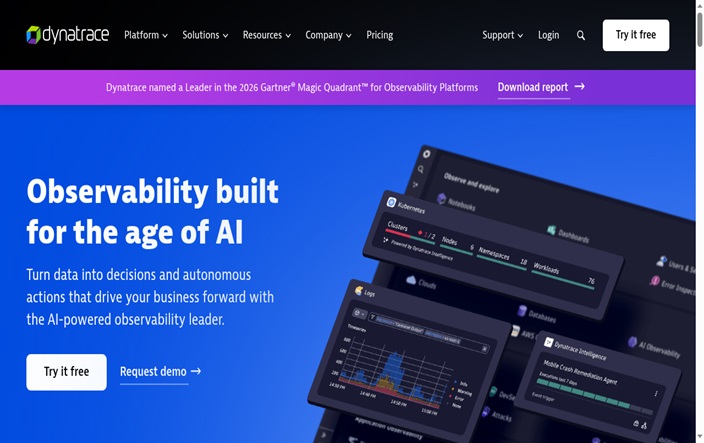
Dynatrace leans hard into automation. Its Davis AI engine handles root-cause analysis automatically, and full-stack instrumentation happens without much manual configuration. That makes it a strong fit for large, regulated enterprises running hundreds of services. It's priced and built for that scale, so smaller teams often find the cost and setup heavier than what they need.
Nagios Core's classic monitoring interface
8. Nagios
Nagios is one of the oldest names here, and it still has a large plugin ecosystem behind it. It's highly configurable, which is both its strength and its weakness: the interface feels dated next to modern tools, and setup takes considerably longer than the zero-config options above.
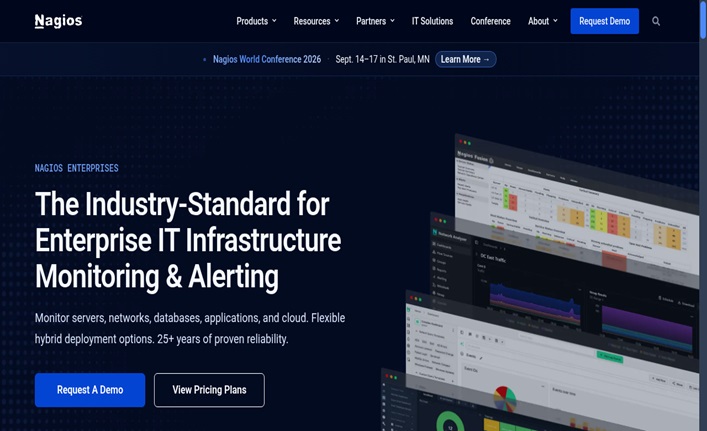
Nagios Core's classic monitoring interface
9. PRTG Network Monitor
PRTG, built by Paessler, is a commercial, sensor-based tool aimed at SMBs and network-heavy environments. Its UI is more approachable than Nagios's, and licensing is based on sensor count rather than hosts or data volume, which can work out cheaper for network-focused shops.
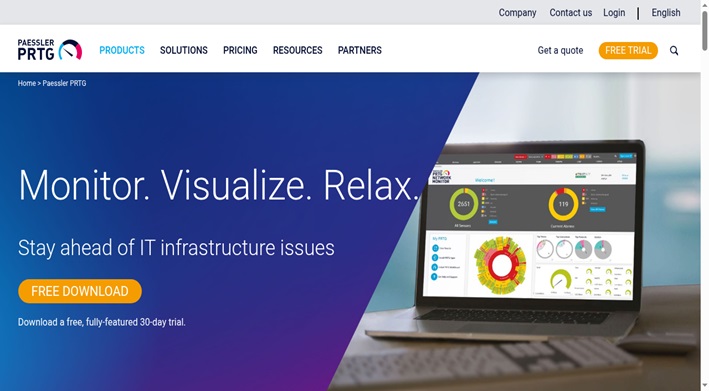
PRTG's sensor-based network monitoring dashboard
10. SolarWinds
SolarWinds is an established name in traditional enterprise IT and network monitoring, with a modular product lineup including SolarWinds Observability and its Network Performance Monitor. It's worth mentioning that SolarWinds was the target of a major supply-chain security incident in 2020, and the company has since invested heavily in rebuilding its security posture. For teams already standardized on SolarWinds' broader IT suite, its monitoring tools are a practical extension of what they already run.
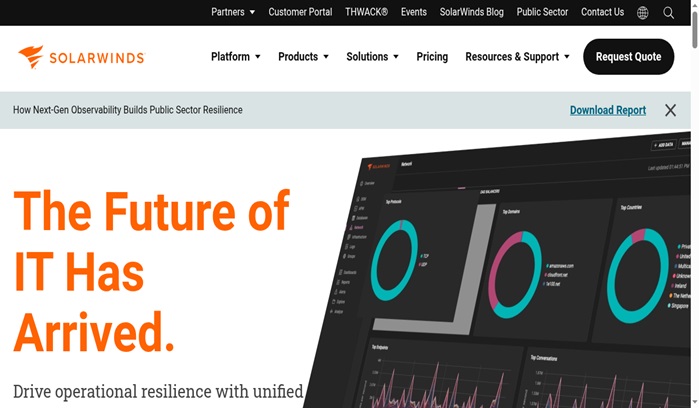
SolarWinds Observability platform, part of the company's modular product suite
Choosing the right fit
There's no single best answer here, only the right tool for where your infrastructure actually is right now. If you're setting up monitoring for the first time, whether that's a personal project, a small team's production environment, or a proof of concept at work, starting with something lightweight and fast to configure saves you from days of setup work you don't need yet.
From there, the open-source stack of Prometheus, Grafana, and Zabbix gives you deep customization once you know exactly what you're measuring and why, and the commercial platforms like Datadog, New Relic, Dynatrace, PRTG, and SolarWinds make more sense once you have a budget and a team large enough to need centralized, vendor-managed observability. Mature observability practices are linked to roughly 40% reductions in mean time to resolve incidents, based on industry analysis from Coherent Market Insights, so whichever tool you land on, the goal is the same: know something's wrong before your users do, and know why fast enough to fix it.
Developers who want to go deeper on the underlying practices can look at learning the fundamentals of DevOps or spend some time weighing the tradeoffs of a DevOps workflow before picking a monitoring stack to build around it. Whatever you choose, keeping data reliable across your DevOps pipeline matters just as much as catching the next outage.
Advertisement
Advertisement