Home »
Python »
Python Data Visualization
Python | Adding Theta in Plot Label
In this article, we are going to learn how to add 𝜭 (theta) letter in the plot label in Python?
Submitted by Anuj Singh, on July 18, 2020
Theta (𝜭) is very often used greek mathematical letters and has a higher repetition in probability. In this article, we are going to add 𝜭 using a command in matplotlib.
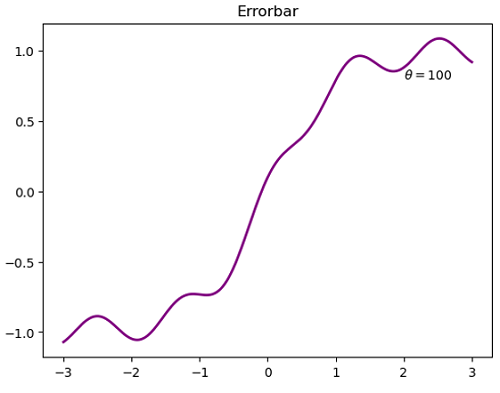
plt.text(3, 0.4, r'$\theta=100$')
#Adding 𝜭 as text
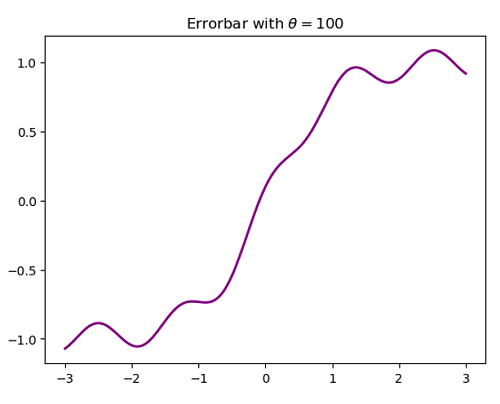
plt.title('Errorbar with 'r'$\theta=100$')
#Adding 𝜭 in title of the figure
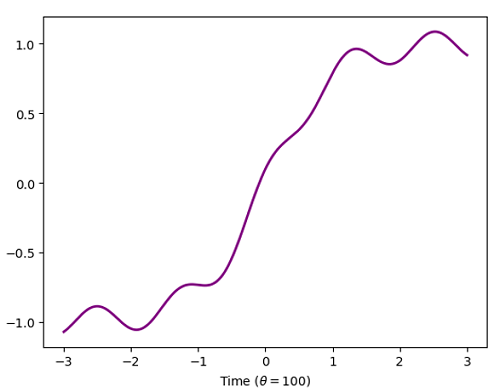
plt.xlabel('Time ('r'$\theta=100)$')
#Adding 𝜭 in title of the figure
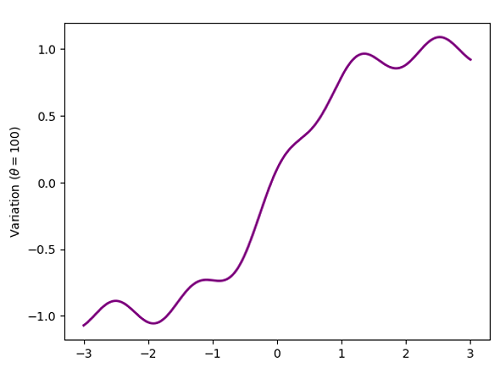
plt.ylabel('Variation ('r'$\theta=100)$')
#Adding 𝜭 in title of the figure
Python code for adding omega in plot label
import numpy as np
import matplotlib.pyplot as plt

x = np.linspace(-3, 3, 201)
y = np.tanh(x) + 0.1 * np.cos(5 * x)

# In text
plt.figure()
plt.plot(x, y, linewidth=2.0, color='purple')
plt.title('Errorbar')
plt.text(2, 0.8, r'$\theta=100$')
plt.show()

# In title
plt.figure()
plt.plot(x, y, linewidth=2.0, color='purple')
plt.title('Errorbar with 'r'$\theta=100$')
plt.show()

# In x-axis label
plt.figure()
plt.plot(x, y, linewidth=2.0, color='purple')
plt.xlabel('Time ('r'$\theta=100)$')
plt.show()

# In y-axis label
plt.figure()
plt.plot(x, y, linewidth=2.0, color='purple')
plt.ylabel('Variation ('r'$\theta=100)$')
plt.show()
Output:
Output is as figure
Advertisement
Advertisement