Home »
Python »
Python Data Visualization
Adding vertical/horizontal lines with different line styles in a Python plot
In this article, we are going to learn how to add vertical/horizontal lines with different line styles in matplotlib figures (Python plot)?
Submitted by Anuj Singh, on July 30, 2020
Adding a vertical and horizontal line together could be required for marking the extreme regions or something related to boundary limit in a plot. We can use different line styles in a plot to draw multiple lines in a plot stating multiple meanings. Matplotlib provides different types of line styles for such operations and in this article, we are going to explore some of them.
Supported line styles: '-', '--', '-.', ':', 'None', ' ', '', 'solid', 'dashed', 'dashdot', 'dotted'
Python code for adding vertical/horizontal lines with different line styles in a plot
import numpy as np
import matplotlib.pyplot as plt
x = np.arange(0.1, 5, 0.1)
y = np.exp(-x)
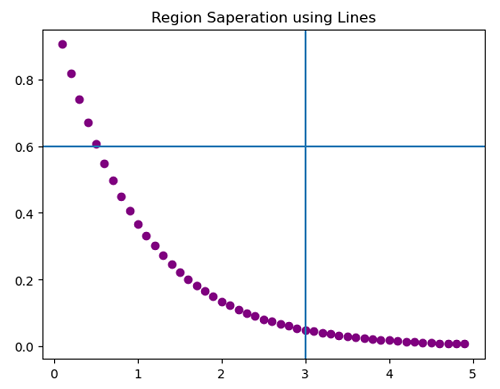
plt.figure()
plt.plot(x,y, 'o', color='purple')
plt.axvline(x=3)
plt.axhline(y=0.6)
plt.title('Region Saperation using Lines')
plt.show()
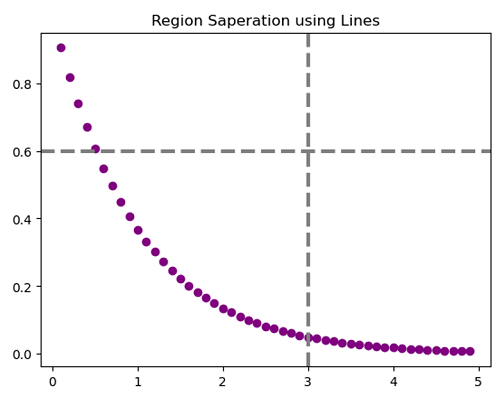
plt.figure()
plt.plot(x,y, 'o', color='purple')
plt.axvline(x=3, ls='--', linewidth=3.0, color='grey')
plt.axhline(y=0.6, ls='--', linewidth=3.0, color='grey')
plt.title('Region Saperation using Lines')
plt.show()
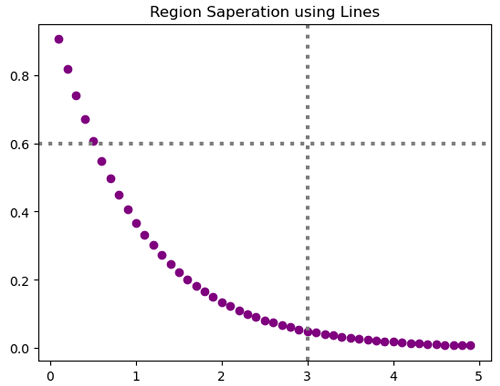
plt.figure()
plt.plot(x,y, 'o', color='purple')
plt.axvline(x=3, ls=':', linewidth=3.0, color='grey')
plt.axhline(y=0.6, ls=':', linewidth=3.0, color='grey')
plt.title('Region Saperation using Lines')
plt.show()
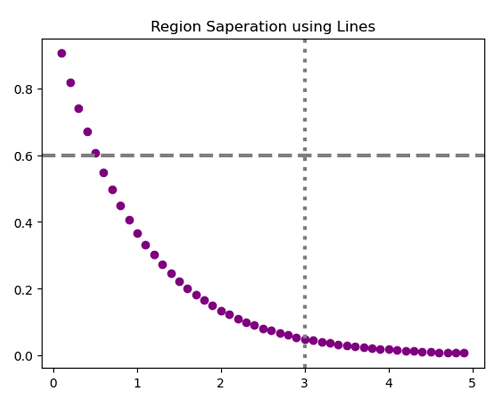
plt.figure()
plt.plot(x,y, 'o', color='purple')
plt.axvline(x=3, ls=':', linewidth=3.0, color='grey')
plt.axhline(y=0.6, ls='--', linewidth=3.0, color='grey')
plt.title('Region Saperation using Lines')
plt.show()
plt.figure()
plt.plot(x,y, 'o', color='purple')
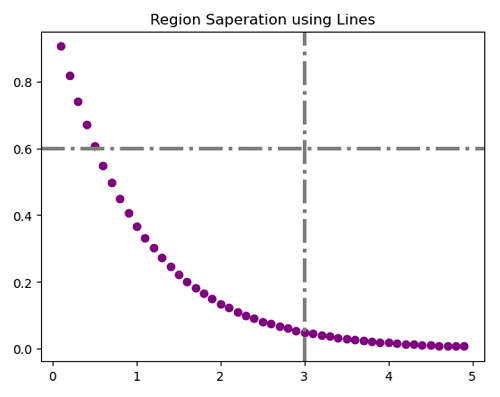
plt.axvline(x=3, ls='-.', linewidth=3.0, color='grey')
plt.axhline(y=0.6, ls='-.', linewidth=3.0, color='grey')
plt.title('Region Saperation using Lines')
plt.show()
Output:
Output is as figure
Advertisement
Advertisement