Home »
Python »
Python Data Visualization
Adding Vertical Line in a Python Plot
In this article, we are going to learn how to add a vertical line in matplotlib figures (Python plot)?
Submitted by Anuj Singh, on July 30, 2020
A vertical line is required for marking the extreme range or something related to the boundary limit. In some cases, it is also used for defining outliers, and therefore, it turns out to be a good technique in data visualization, and therefore, matplotlib has an inbuilt defined function for our operation, matplotlib.pyplot.axvline().
The following example illustrates all four possible examples.
Python code for adding vertical line in a plot
import numpy as np
import matplotlib.pyplot as plt
x = np.arange(0.1, 5, 0.1)
y = np.tan(x)*np.exp(-x)
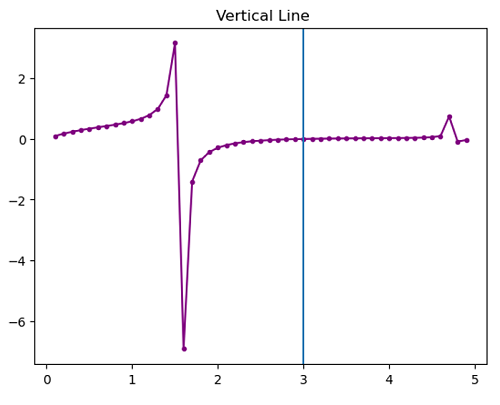
plt.figure()
plt.plot(x,y, '.-', color='purple')
plt.axvline(x=3)
plt.title(' Vertical Line')
plt.show()
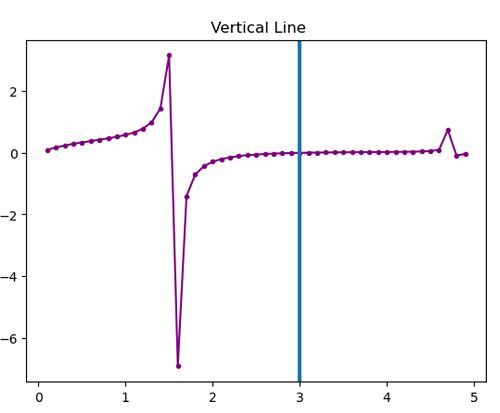
plt.figure()
plt.plot(x,y, '.-', color='purple')
plt.axvline(x=3, linewidth=3.0)
plt.title(' Vertical Line')
plt.show()
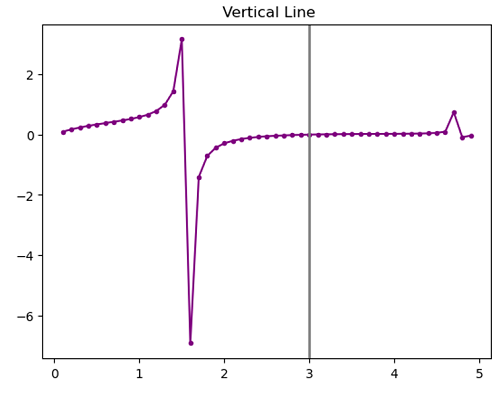
plt.figure()
plt.plot(x,y, '.-', color='purple')
plt.axvline(x=3, linewidth=2.0, color='grey')
plt.title(' Vertical Line')
plt.show()
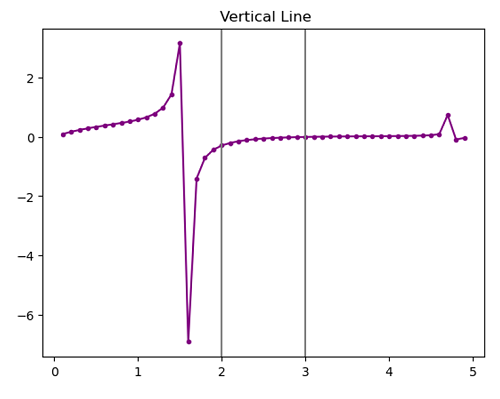
plt.figure()
plt.plot(x,y, '.-', color='purple')
plt.axvline(x=2, color='grey')
plt.axvline(x=3, color='grey')
plt.title(' Vertical Line')
plt.show()
Output:
Output is as figure
Advertisement
Advertisement