Home »
Python »
Python Data Visualization
Python | Arrow in Plotting
Arrow in Plotting in Python. Here, we are going to learn about the arrow in plotting and its Python implementation.
Submitted by Anuj Singh, on July 20, 2020
In this tutorial, we are going to learn how to add an arrow to a plot? Matplotlib has provided an inbuilt function for plotting an arrow matplotlib.pyplot.arrow().
The following example illustrates the implementation and use of the Arrow.
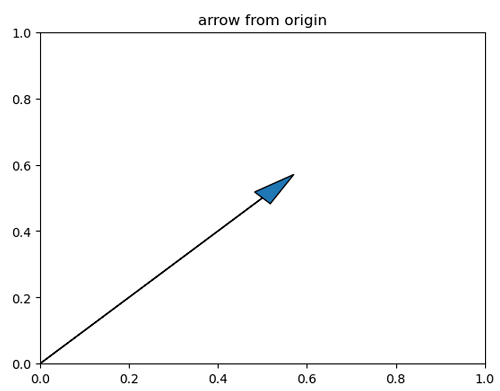
# Arrow starting from origin
# head dimension 1x0.05
# Arrow tip point :(x,y) = (0.5,0.5)
matplotlib.pyplot.arrow(0, 0, 0.5, 0.5, head_width=0.05, head_length=0.1)
Python code for arrow in plotting
import matplotlib.pyplot as plt
plt.figure()
plt.arrow(0, 0, 0.5, 0.5, head_width=0.05, head_length=0.1)
plt.title('arrow from origin')
plt.show()
plt.figure()
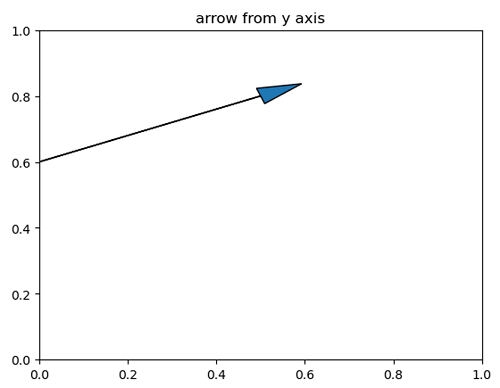
plt.arrow(0, 0.6, 0.5, 0.2, head_width=0.05, head_length=0.1)
plt.title('arrow from y axis')
plt.show()
plt.figure()
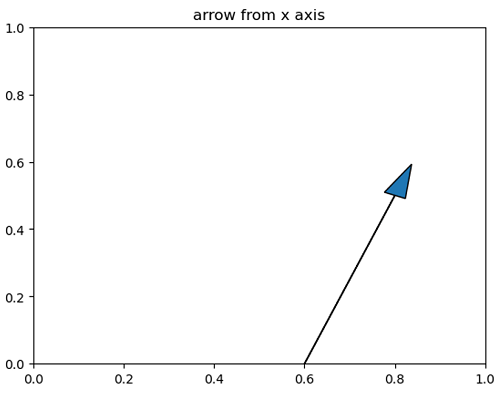
plt.arrow(0.6, 0, 0.2, 0.5, head_width=0.05, head_length=0.1)
plt.title('arrow from x axis')
plt.show()
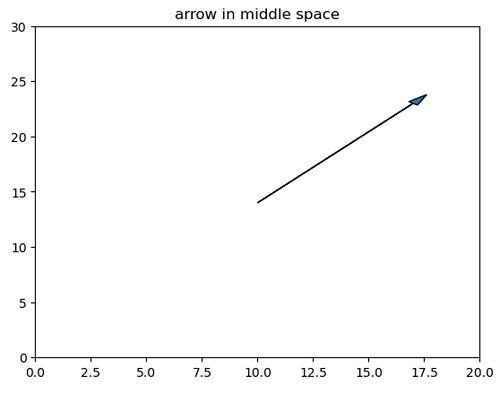
plt.figure()
plt.arrow(10, 14, 7, 9, head_width=0.5, head_length=1)
plt.xlim(0,20)
plt.ylim(0,30)
plt.title('arrow in middle space')
plt.show()
Output:
Output is as figure
Advertisement
Advertisement