Home »
Python »
Python Data Visualization
Python | Autocorrelation Plot using Matplotlib
matplotlib.pyplot.acorr(): In this tutorial, we are going to learn how to plot autocorrelation in python using matplotlib?
Submitted by Anuj Singh, on July 24, 2020
In some of the applications, we need to plot autocorrelation and therefore, matplotlib has an inbuilt defined function for our desired operation i.e. matplotlib.pyplot.acorr(). Following are the examples showing the implementation of matplotlib.pyplot.acrr().
Illustration:
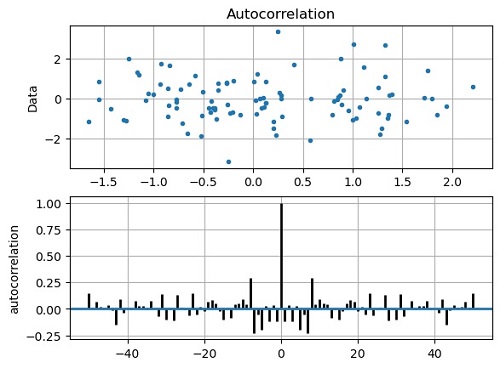
matplotlib.pyplot.acorr(x, usevlines=True, normed=True, maxlags=50, lw=2)
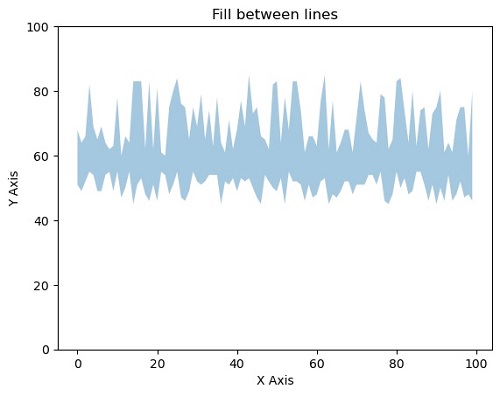
matplotlib.pyplot.fill_between(x, y, yy, alpha=0.4)
#Filling the area between two lines completely with opaque ratio 0.4
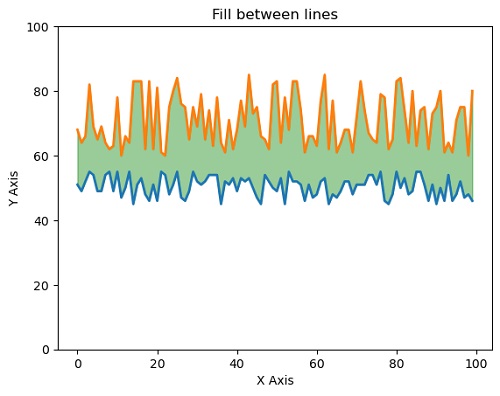
matplotlib.pyplot.plot(x,y, yy, linewidth=2.0)
matplotlib.pyplot.fill_between(x, y, yy, color='green', alpha=0.4)
#Filling the area between two lines completely
#in addition to show the lines as well.
Python code for autocorrelation plot using matplotlib
import matplotlib.pyplot as plt
import numpy as np

x, y = np.random.randn(2, 100)

plt.figure()
plt.subplot(211)
plt.plot(x, y, '.')
plt.title('Autocorrelation')
plt.ylabel('Data')
plt.grid(True)

plt.subplot(212)
plt.acorr(x, usevlines=True, normed=True, maxlags=50, lw=2)
plt.ylabel('autocorrelation')
plt.grid(True)

plt.show()
Output:
Output is as figure
Advertisement
Advertisement