Home »
Python »
Python Data Visualization
Python | Available Unfilled Markers in Matplotlib
In this article, we are going to explore different unfilled markers available in Python matplotlib?
Submitted by Anuj Singh, on August 21, 2020
Illustrations:
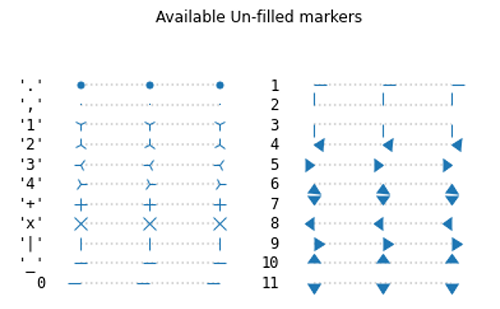
Python code for available unfilled markers in matplotlib
import matplotlib.pyplot as plt
from matplotlib.lines import Line2D

def axfmt(ax):
    ax.margins(0.2)
    ax.set_axis_off()
    ax.invert_yaxis()


def split(a_list):
    i_half = len(a_list) // 2
    return a_list[:i_half], a_list[i_half:]

fig, axs = plt.subplots(ncols=2)
fig.suptitle('Available Un-filled markers')

unfilled_markers = [m for m, func in Line2D.markers.items()
                    if func != 'nothing' and m not in Line2D.filled_markers]

for ax, markers in zip(axs, split(unfilled_markers)):
    for y, marker in enumerate(markers):
        ax.text(-0.5, y, repr(marker), horizontalalignment='right',
                verticalalignment='center', fontsize=12,
                fontfamily='monospace')

        ax.plot([y] * 3, marker=marker, linestyle=':', color='0.8',
                markersize=10, markerfacecolor="tab:blue",
                markeredgecolor="tab:blue")
    axfmt(ax)
plt.show()
Output:
Output is as Figure
Advertisement
Advertisement