Home »
Python »
Python Data Visualization
Binary Cap Symbol in Python Plotting
Here, we are going to learn how to add binary cap symbol in Python plotting?
Submitted by Anuj Singh, on September 01, 2020
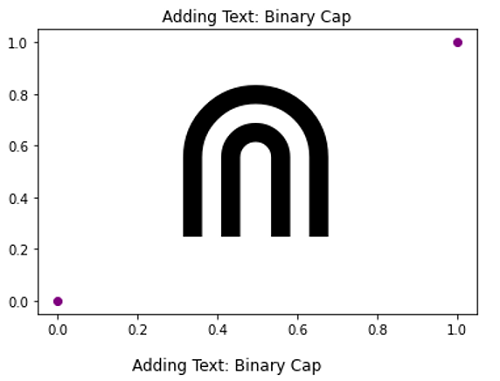
Binary Cap is a different symbol used in set theory and other mathematical expressions. Python has provided us to use it while plotting. Following example shows its implementation.
plt.text(0.25, 0.25, r'$\Cap$', fontsize=175)
Illustrations:
Python code for binary cap symbol in plotting
import numpy as np
import matplotlib.pyplot as plt
#Binary Cap
#In text
plt.figure()
plt.plot([0,1],[0,1], 'o', color= 'purple')
plt.title('Adding Text: Binary Cap')
plt.text(0.25, 0.25, r'$\Cap$', fontsize=175, )
plt.show()
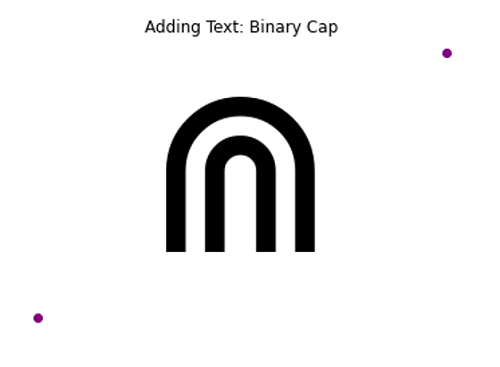
plt.figure()
plt.plot([0,1],[0,1], 'o', color= 'purple')
plt.title('Adding Text: Binary Cap')
plt.text(0.25, 0.25, r'$\Cap$', fontsize=175, )
plt.axis(False)
plt.show()
Output:
Output is as Figure
Advertisement
Advertisement