Home »
Python »
Python Data Visualization
Bold Text Label in Python Plot
Here, we are going to learn how to make text and labels bold in matplotlib figures (Python plots)?
Submitted by Anuj Singh, on July 23, 2020
Make a textbox or label in figure bold
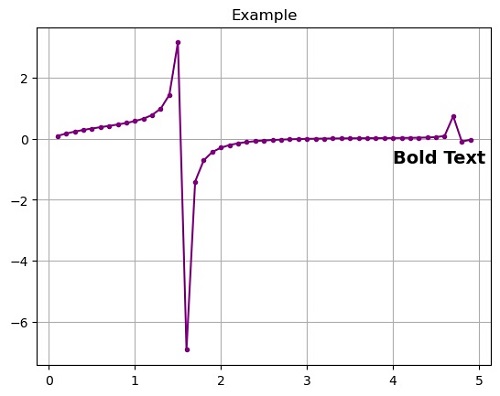
The command fontweight='bold' can be used to make a textbox or label in figure bold. The following example illustrates all four possible examples.
plt.text(4, -0.8, 'Bold Text', fontsize=14.0, fontweight='bold')
#Making Bold Text Box
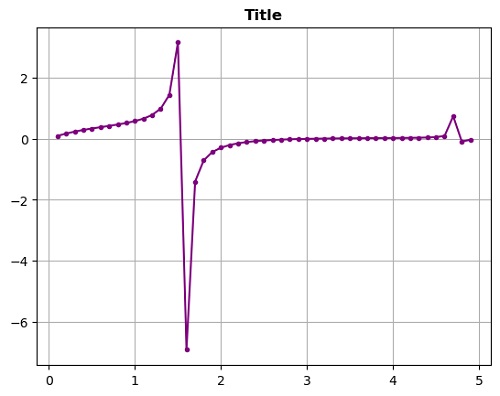
Make title bold
plt.title('Title', fontweight='bold')
#Making text bold in title of the figure
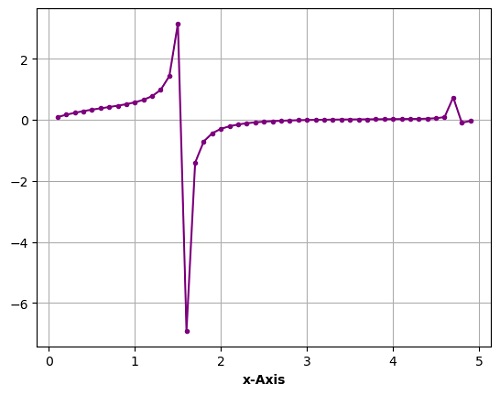
Make x-axis bold
plt.xlabel('x-Axis', fontweight='bold')
#Making text bold in x axis label of the figure
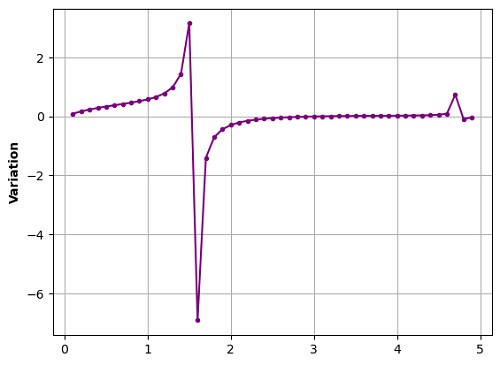
Make Y label's variation bold
plt.ylabel('Variation', fontweight='bold')
#Making text bold in y axis label of the figure
Python Program for Making Bold Text Label in Plot
import numpy as np
import matplotlib.pyplot as plt

x = np.arange(0.1, 5, 0.1)
y = np.tan(x)*np.exp(-x)

#Lowercase Delta
#In text
plt.figure()
plt.plot(x,y, '.-', color='purple')
plt.title('Example')
plt.text(4, -0.8, 'Bold Text', fontsize=14.0, fontweight='bold')
plt.grid()
plt.show()

#In title
plt.figure()
plt.plot(x,y, '.-', color='purple')
plt.title('Title', fontweight='bold')
plt.grid()
plt.show()

#In x-axis label
plt.figure()
plt.plot(x,y, '.-', color='purple')
plt.xlabel('x-Axis', fontweight='bold')
plt.grid()
plt.show()

#In y-axis label
plt.figure()
plt.plot(x,y, '.-', color='purple')
plt.ylabel('Variation', fontweight='bold')
plt.grid()
plt.show()
Output:
Output is as figure
Advertisement
Advertisement