Home »
Python »
Python Data Visualization
Python | Clockwise and Anticlockwise Pie Chart
In this tutorial, we are going to explore the clockwise and anticlockwise mode of plotting Pie charts.
Submitted by Anuj Singh, on August 05, 2020
Following example is an illustration for the same.
Illustration:
Python code for clockwise and anticlockwise pie chart
import matplotlib.pyplot as plt
# Pie chart, where the slices will be
# ordered and plotted counter-clockwise:
labels = 'A', 'B', 'C', 'D', 'E', 'F'
sizes = [15, 20, 10, 17, 1, 37]
alp = (0.9, 0.9, 0.9, 0, 0.9, 0.9)
plt.figure()
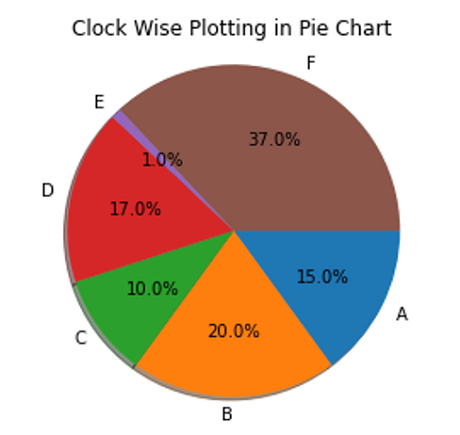
plt.title('Clock Wise Plotting in Pie Chart')
plt.pie(sizes, labels=labels, counterclock=False, autopct='%1.1f%%', shadow=True)
plt.axis('equal')
plt.show()
plt.figure()
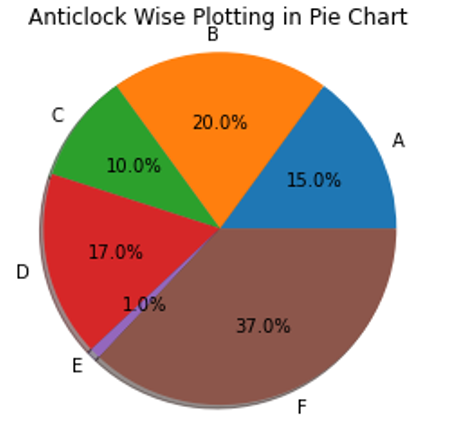
plt.title('Anticlock Wise Plotting in Pie Chart')
plt.pie(sizes, labels=labels, counterclock=True, autopct='%1.1f%%', shadow=True)
plt.axis('equal')
plt.show()
Output:
Output is as figure
Advertisement
Advertisement