Home »
Python »
Python Data Visualization
Python | Contour Plot
In this tutorial, we are going to learn how to create a contour plot using matplotlib in Python?
Submitted by Anuj Singh, on August 18, 2020
A graphical technique in which we try to represent a 3-dimensional surface with slices as a constant z-axis is called contours. It is a 3D plot in a 2-dimensional format. Such types of plots are mostly used by geophysicists and also have a good application electrodynamics' plots. It is a type of surface plot represented by lines and therefore has good importance in data visualization. Matplotlib has an inbuilt defined function for plotting contours and the following figure is an implementation of the contour plots.
Illustrations:

Python code for contour plot
import numpy as np
import matplotlib.pyplot as plt
imm = np.array([[0.8, 2.4, 2.5, 3.9, 0.0, 4.0, 0.0],
[2.4, 0.0, 5.0, 5.0, 2.7, 5.0, 0.0],
[2.1, 2.4, 5.8, 4.3, 5.9, 4.4, 2.0],
[4.6, 0.0, 3.3, 5.0, 3.1, 0.0, 0.8],
[4.7, 0.7, 5.6, 2.6, 2.2, 6.2, 3.0],
[1.3, 5.2, 2.0, 5.5, 5.9, 3.2, 5.1],
[0.1, 2.0, 5.0, 1.4, 5.0, 1.9, 6.3]])
plt.figure()
plt.contour(imm)
plt.inferno()
plt.colorbar()
plt.title('Contour Plot')
plt.show()
plt.figure()
plt.contour(imm)
plt.inferno()
plt.colorbar()
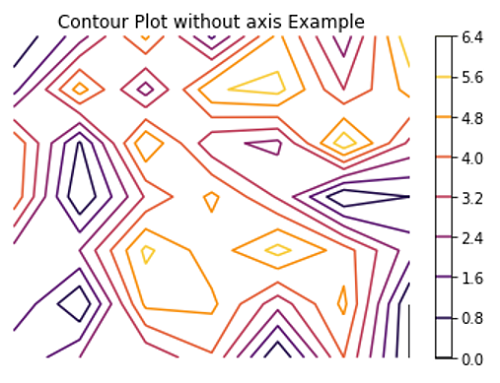
plt.axis(False)
plt.title('Contour Plot without axis Example')
plt.show()
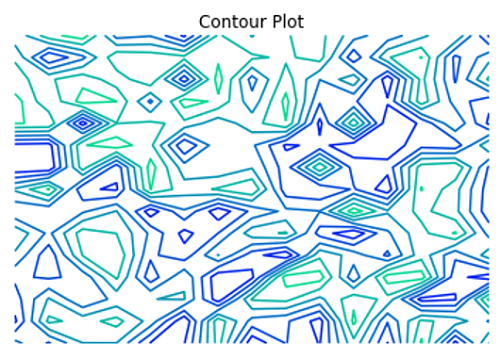
im2 = np.random.random([15,15])
plt.figure()
plt.contour(im2)
plt.axis(False)
plt.winter()
plt.title('Contour Plot')
Output:
Output is as Figure
Advertisement
Advertisement