Home »
Python »
Python Data Visualization
Python | Cross(X) Scatter Marker in Matplotlib
In this tutorial, we are going to learn how to use cross (X) shape scatter marker in scatter plot using matplotlib in Python?
Submitted by Anuj Singh, on August 16, 2020
Cross(X) Scatter Marker in Matplotlib
There are few markers that can be used everywhere such as circular or square markers. But, matplotlib has some other inbuilt defined markers such as cross(X) shape marker which is used in marking plots.
Cross(X) Scatter Marker Illustrations
In matplotlib.pyplot command marker='4' for our desired marker style and the following figure illustrates the example of the same.

Python program for cross(x) scatter marker in matplotlib
import numpy as np
import matplotlib.pyplot as plt
# Example 1
x = np.arange(50)
y = np.random.randint(0,50,50)
ss = np.random.randint(0,50,50)
c = np.random.randint(0,50,50)
plt.figure()
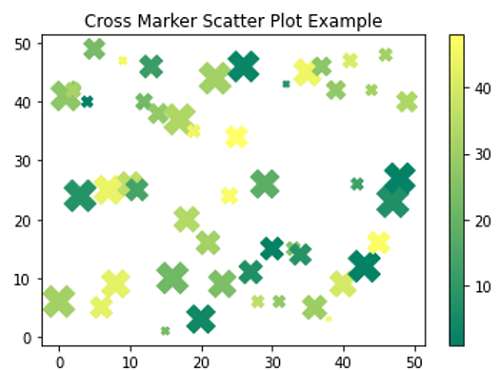
plt.scatter(x,y, s=ss*10, c=c, marker='X', cmap='summer')
plt.title('Cross Marker Scatter Plot Example')
plt.colorbar()
# Example 2
x = np.arange(50)
y = np.random.randint(0,50,50)
ss = np.random.randint(0,50,50)
c = np.random.randint(0,50,50)
plt.figure()
plt.scatter(x,y, s=ss*10, c=c, marker='X')
plt.title('Cross Scatter Plot Example')
plt.colorbar()
# Example 3
x = np.arange(50)
y = np.random.randint(0,50,50)
ss = np.random.randint(0,50,50)
c = np.random.randint(0,50,50)
plt.figure()
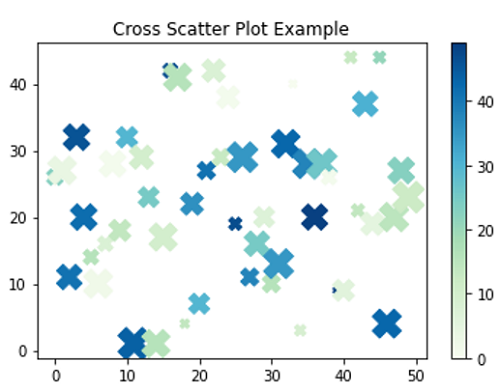
plt.scatter(x,y, s=ss*10, c=c, marker='X', cmap='GnBu')
plt.title('Cross Scatter Plot Example')
plt.colorbar()
Output:
Output is as Figure
Advertisement
Advertisement