Home »
Python »
Python Data Visualization
Python | Custom Bin Size in Histogram Plotting
Here, we are going to learn about the custom bin size in histogram plotting and its Python implementation.
Submitted by Anuj Singh, on July 20, 2020
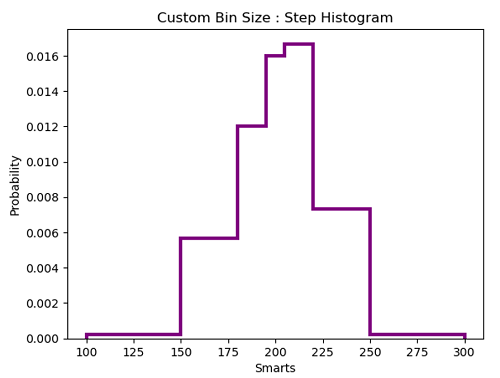
In this tutorial, we are going to modify the default feature of histogram i.e. all the bins are of equal size to the custom sizing of each bin. Matplotlib provides this freehand for us using a list for bins parameters.
The following example illustrates the implementation and use of Custom Bin Sizing.
# Bin points number with variable size
bins = [100, 150, 180, 195, 205, 220, 250, 300]
matplotlib.pyplot.hist(x, bins=bins, density=True, histtype='barstacked', rwidth=1)
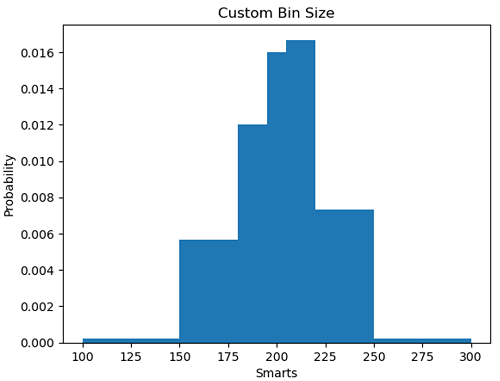
Python code for custom bin size in histogram plotting
import matplotlib.pyplot as plt
import numpy as np

# random data generation
mu_x = 200
sigma_x = 25
x = np.random.normal(mu_x, sigma_x, size=100)
bins = [100, 150, 180, 195, 205, 220, 250, 300]

# Histogram of the Data
plt.figure()
plt.hist(x, bins=bins, density=True, histtype='barstacked', rwidth=1)
plt.title('barstacked')
plt.xlabel('Smarts')
plt.ylabel('Probability')
plt.title('Custom Bin Size')
plt.show()

plt.figure()
plt.hist(x, bins=bins, color='purple', density=True, histtype='step', linewidth=3.0)
plt.xlabel('Smarts')
plt.ylabel('Probability')
plt.title('Custom Bin Size : Step Histogram')
plt.show()

bins = [100, 150, 180, 195, 205, 220, 250, 300]
Output:
Output is as figure
Advertisement
Advertisement