Home »
Python »
Python Data Visualization
Python | Different Head Types using Overhang Command in Matplotlib
In this article, we are going to explore different types of head (with default shape) using the overhang command of matplotlib.
Submitted by Anuj Singh, on July 31, 2020
We have shown the arrow shape with overhang value from 0.8 to -1 (with the gap of two). Any of them can be used for different applications. Following are the plots as an output from the python code.
Python code for different head types using overhang command in matplotlib
import matplotlib.pyplot as plt
plt.figure()
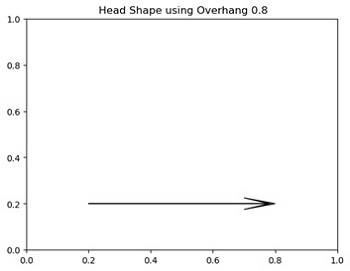
plt.arrow(0.2, 0.2, 0.5, 0, overhang=0.8, head_width=0.05, head_length=0.1)
plt.title(' Head Shape using Overhang 0.8')
plt.show()
plt.figure()
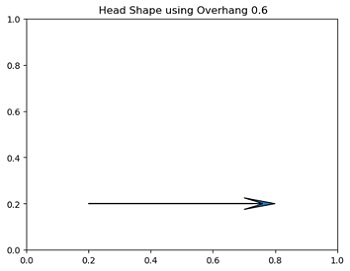
plt.arrow(0.2, 0.2, 0.5, 0, overhang=0.6, head_width=0.05, head_length=0.1)
plt.title(' Head Shape using Overhang 0.6')
plt.show()
plt.figure()
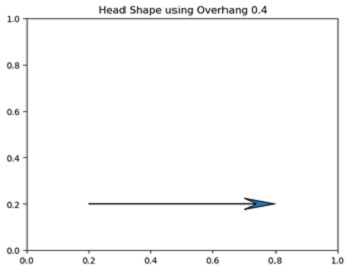
plt.arrow(0.2, 0.2, 0.5, 0, overhang=0.4, head_width=0.05, head_length=0.1)
plt.title(' Head Shape using Overhang 0.4')
plt.show()
plt.figure()
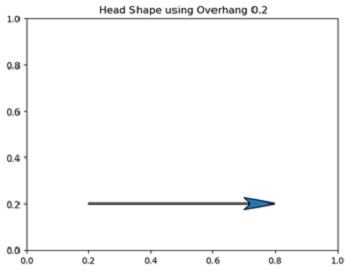
plt.arrow(0.2, 0.2, 0.5, 0, overhang=0.2, head_width=0.05, head_length=0.1)
plt.title(' Head Shape using Overhang 0.2')
plt.show()
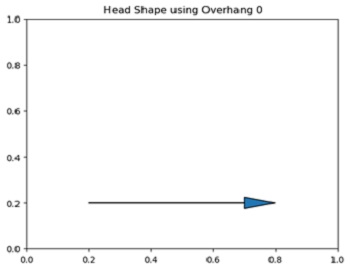
plt.figure()
plt.arrow(0.2, 0.2, 0.5, 0, overhang=0, head_width=0.05, head_length=0.1)
plt.title(' Head Shape using Overhang 0')
plt.show()
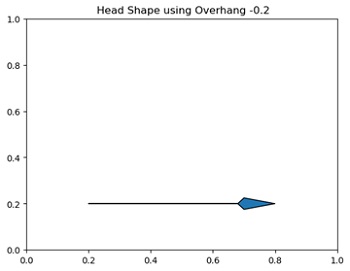
plt.figure()
plt.arrow(0.2, 0.2, 0.5, 0, overhang=-0.2, head_width=0.05, head_length=0.1)
plt.title(' Head Shape using Overhang -0.2')
plt.show()
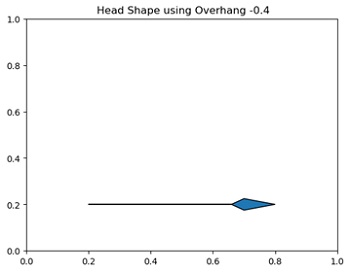
plt.figure()
plt.arrow(0.2, 0.2, 0.5, 0, overhang=-0.4, head_width=0.05, head_length=0.1)
plt.title(' Head Shape using Overhang -0.4')
plt.show()
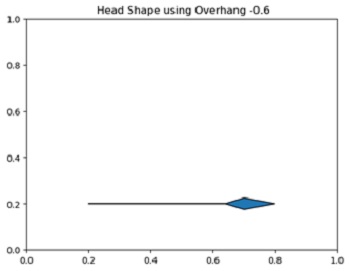
plt.figure()
plt.arrow(0.2, 0.2, 0.5, 0, overhang=-0.6, head_width=0.05, head_length=0.1)
plt.title(' Head Shape using Overhang -0.6')
plt.show()
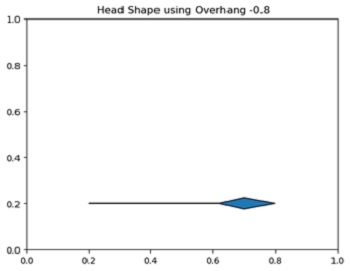
plt.figure()
plt.arrow(0.2, 0.2, 0.5, 0, overhang=-0.8, head_width=0.05, head_length=0.1)
plt.title(' Head Shape using Overhang -0.8')
plt.show()
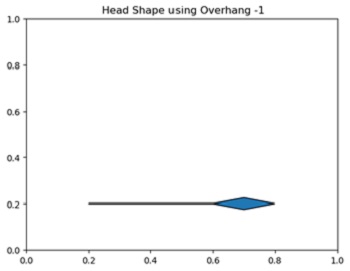
plt.figure()
plt.arrow(0.2, 0.2, 0.5, 0, overhang=-1, head_width=0.05, head_length=0.1)
plt.title(' Head Shape using Overhang -1')
plt.show()
Output:
Output is as figure
Advertisement
Advertisement