Home »
Python »
Python Data Visualization
Dot-Equal Symbol in Python Plotting
Here, we are going to learn how to add dot-equal symbol in Python plotting?
Submitted by Anuj Singh, on September 11, 2020
Dot-Equal is a different symbol used in set theory and other mathematical expressions. Python has provided us to use it while plotting.
Following example shows its implementation.
plt.text(0.25, 0.25, r'$\Doteq$', fontsize=175)
Illustrations:
Python code for dot-equal symbol in plotting
import numpy as np
import matplotlib.pyplot as plt
# Dot-Equal
# In text
plt.figure()
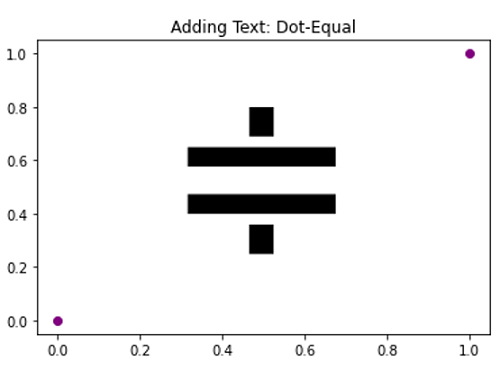
plt.plot([0,1],[0,1], 'o', color= 'purple')
plt.title('Adding Text: Dot-Equal')
plt.text(0.25, 0.25, r'$\Doteq$', fontsize=175, )
plt.show()
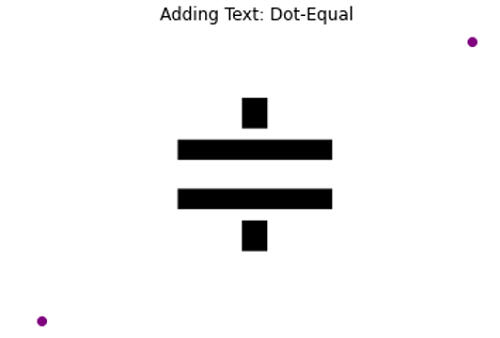
plt.figure()
plt.plot([0,1],[0,1], 'o', color= 'purple')
plt.title('Adding Text: Dot-Equal')
plt.text(0.25, 0.25, r'$\Doteq$', fontsize=175, )
plt.axis(False)
plt.show()
Output:
Output is as Figure
Advertisement
Advertisement