Home »
Python »
Python Data Visualization
Python | Drawing Diagonal Matrix using Matplotlib
In this tutorial, we are going to learn how to draw a diagonal matrix in python using matplotlib?
Submitted by Anuj Singh, on August 05, 2020
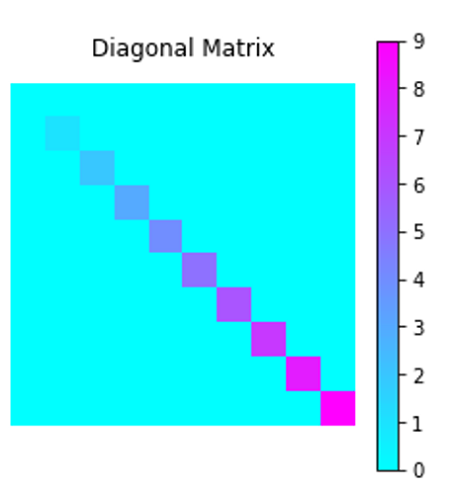
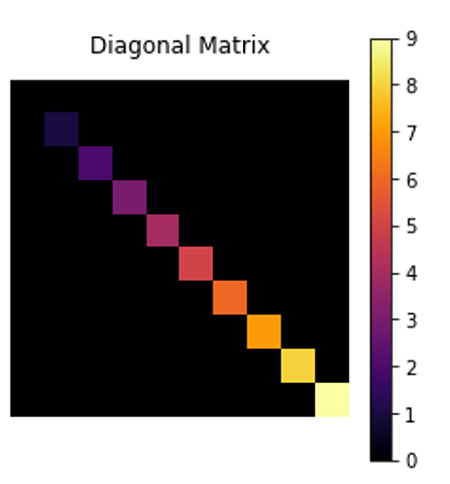
Matplotlib provides an inbuilt function for plotting matrices i.e. matplotlib.pyplot.matshow(). We first define a diagonal matrix using numpy library function numpy.diag() and then plot it using matplotlib. There are a number of color maps available and for illustration, we are using inferno and cool color maps in this article.
Illustration:
Python code for drawing diagonal matrix using matplotlib
import matplotlib.pyplot as plt
import numpy as np

a = np.diag(range(10))
plt.matshow(a)
plt.axis(False)
plt.cool()
plt.title('Diagonal Matrix')
plt.colorbar()
plt.show()

plt.matshow(a)
plt.inferno()
plt.axis(False)
plt.title('Diagonal Matrix')
plt.colorbar(label='mat')
plt.show()
Output:
Output is as figure
Advertisement
Advertisement