Home »
Python »
Python Data Visualization
Python | Enable / Disable Frame on Figure
In this article, we are going to learn how to enable / disable frame on figure in Python?
Submitted by Anuj Singh, on August 14, 2020
Illustration:
Python code for enable / disable frame on figure
import matplotlib.pyplot as plt
import numpy as np
dt = 2
x = np.arange(-50.0, 50.0, dt)
y = np.arange(0, 100.0, dt)
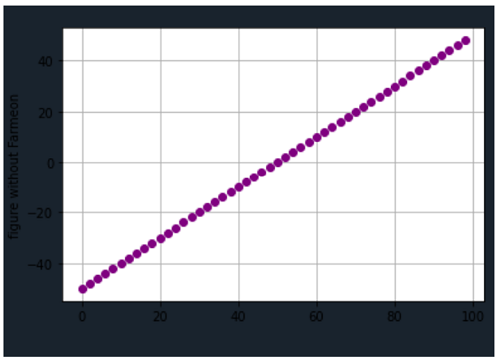
plt.figure(frameon=False)
plt.plot(y, x, 'o', color='purple')
plt.ylabel('figure without Farmeon')
plt.grid()
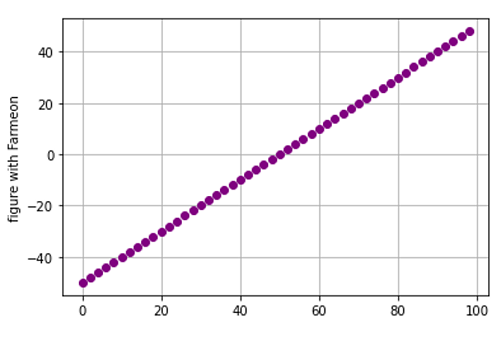
plt.figure(frameon=True)
plt.plot(y, x, 'o', color='purple')
plt.ylabel('figure with Farmeon')
plt.grid()
plt.show()
Output:
Output is as Figure
Advertisement
Advertisement