Home »
Python »
Python Data Visualization
Python | Error Bar in Bar Graph
Python | Error Bar in Bar Graph: Here, we will learn about the Error Bar in Bar Graph and its Python implementation.
Submitted by Anuj Singh, on July 14, 2020
Error is a mathematical term often used to express the extent of quantity (as a probability). In matplotlib, there is a command for visualizing error in bar graphs xerror and yerror.
In this article, we are going to show the use and implementation of error bars in horizontal and vertical bar graphs.
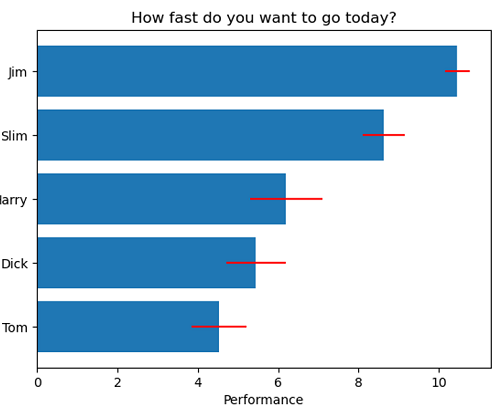
Furthermore, we have a freehand command for changing the colors of error bars.
Syntax:
matplotlib.bar(people, performance, yerr=error, ecolor='r')
Reference: https://matplotlib.org/
Python code for error bar in bar graph
import matplotlib.pyplot as plt
import numpy as np
# Example data
people = ['Tom', 'Dick', 'Harry', 'Slim', 'Jim']
y_pos = np.arange(len(people))
performance = 3 + 10 * np.random.rand(len(people))
error = np.random.rand(len(people))
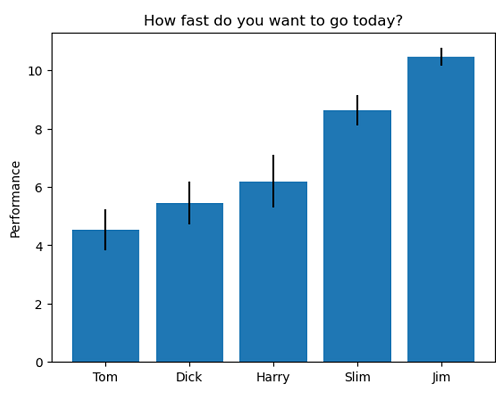
# Default Error Bar
plt.figure()
plt.bar(people, performance, yerr=error)
plt.ylabel('Performance')
plt.title('How fast do you want to go today?')
plt.show()
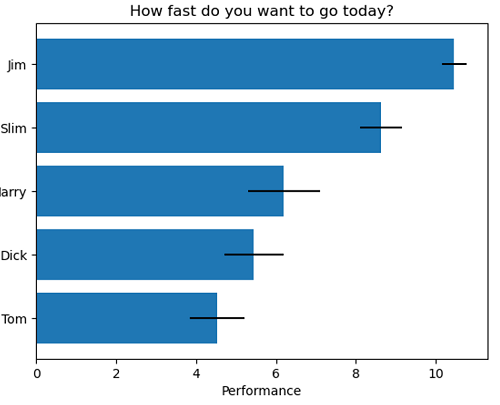
# Default Error Bar
plt.figure()
plt.barh(people, performance, xerr=error, align='center')
plt.xlabel('Performance')
plt.title('How fast do you want to go today?')
plt.show()
# Red Error Bar
plt.figure()
plt.barh(people, performance, xerr=error, ecolor='r')
plt.xlabel('Performance')
plt.title('How fast do you want to go today?')
plt.show()
Output:
Output is as figure
Advertisement
Advertisement