Home »
Python »
Python Data Visualization
Python | Eventplot using Matplotlib
Here, we are going to learn about the eventplot using matplotlib and its Python implementation.
Submitted by Anuj Singh, on August 06, 2020
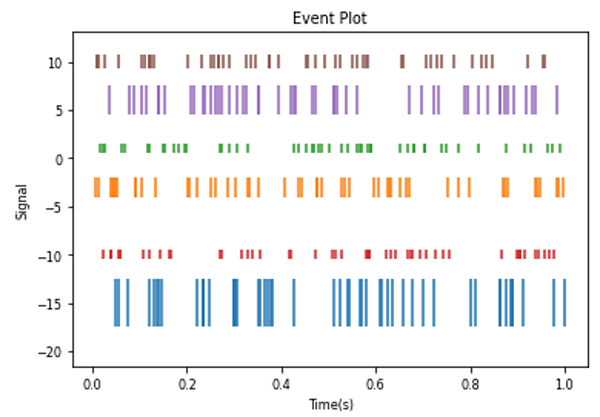
In Eventplot, we use to plot identical parallel lines at the given reference position.
Such plots mostly have an application in neuroscience for representing neural events, where it is usually called a spike raster, dot raster, or raster plot. Furthermore, they can be useful in any area where we need to show the position or timings of multiple sets of discrete events. For example, the arrival times of people to an event on each day of the month or the date of hurricanes each year of the last century.
The following figure shows the implementation of the same.
Illustration:

Python code for eventplot using matplotlib
import matplotlib.pyplot as plt
import numpy as np

data1 = np.random.random([6, 50])

colors1 = ['C{}'.format(i) for i in range(6)]

lineoffsets1 = [-15, -3, 1, -10, 6, 10]
linelengths1 = [5, 2, 1, 1, 3, 1.5]

plt.eventplot(data1, colors=colors1, lineoffsets=lineoffsets1,
                    linelengths=linelengths1)
plt.title('Event Plot')
plt.xlabel('Time(s)')
plt.ylabel('Signal')
Output:
Output is as figure
Advertisement
Advertisement