Home »
Python »
Python Data Visualization
Python | Fill Plot Example
Here, we are going to learn about the fill plot example and its Python implementation.
Submitted by Anuj Singh, on August 06, 2020
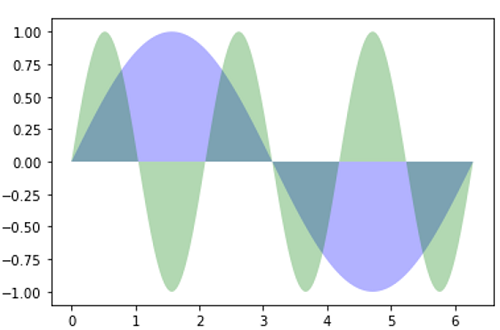
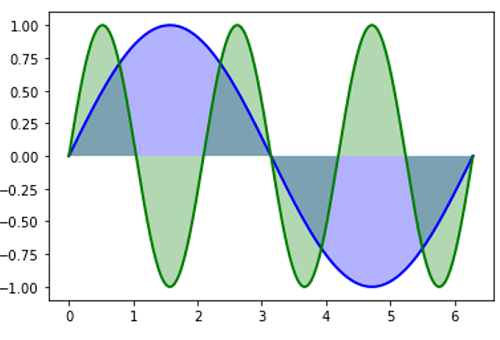
We are presenting a demo for the fill plot where we are plotting two functions with different colors. Furthermore, there is also a plot including an edge line with line width 2.0 for showing how we can independently also plotline in the same figure.
The following figure shows the implementation of Fill Plot Demo.
Illustration:
Python code to demonstrate the example of fill plot example
import numpy as np
import matplotlib.pyplot as plt
x = np.linspace(0, 2 * np.pi, 500)
y1 = np.sin(x)
y2 = np.sin(3 * x)
plt.figure()
plt.fill(x, y1, 'b', x, y2, 'g', alpha=0.3)
plt.show()
plt.figure()
plt.fill(x, y1, 'b', x, y2, 'g', alpha=0.3)
plt.plot(x, y1, 'b', x, y2, 'g', linewidth=2.0)
plt.show()
plt.figure()
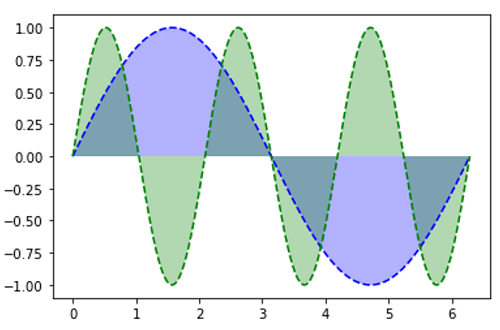
plt.fill(x, y1, 'b', x, y2, 'g', alpha=0.3)
plt.plot(x, y1, 'b--', x, y2, 'g--')
plt.show()
Output:
Output is as figure
Advertisement
Advertisement