Home »
Python »
Python Data Visualization
Python | Fraction in Matplotlib
In this article, we are going to learn how to plot a fraction in figure using matplotlib?
Submitted by Anuj Singh, on August 20, 2020
Illustrations:
Python code for fraction in matplotlib
import matplotlib.pyplot as plt
plt.figure()
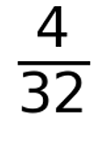
plt.text(0.5, 0.5, r"$\frac{4}{32}$", fontsize=60)
plt.axis(False)
plt.show()
plt.figure()
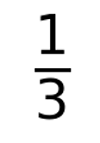
plt.text(0.5, 0.5, r"$\frac{1}{3}$", fontsize=60)
plt.axis(False)
plt.show()
plt.figure()
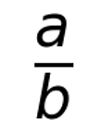
plt.text(0.5, 0.5, r"$\frac{a}{b}$", fontsize=60)
plt.axis(False)
plt.show()
Output:
Output is as Figure
Advertisement
Advertisement