Home »
Python »
Python Data Visualization
Python | Grayscale or Monochrome Plotting
In this tutorial, we are going to learn how to change the figure into monochrome or grayscale?
Submitted by Anuj Singh, on August 06, 2020
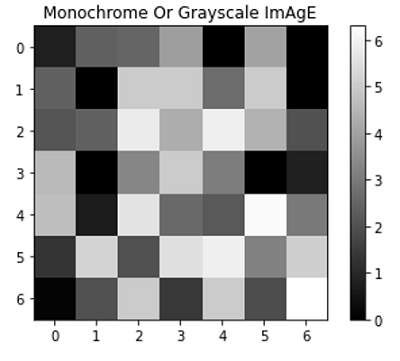
There is an inbuilt defined function i.e. matplotlib.pyplot.gray( ), using which we can switch our plot to monochrome or grayscale. The following example shows us how to implement the function in python using matplotlib.
Illustration:
Python code for grayscale or monochrome plotting
import numpy as np
import matplotlib.pyplot as plt


imm = np.array([[0.8, 2.4, 2.5, 3.9, 0.0, 4.0, 0.0],
                    [2.4, 0.0, 5.0, 5.0, 2.7, 5.0, 0.0],
                    [2.1, 2.4, 5.8, 4.3, 5.9, 4.4, 2.0],
                    [4.6, 0.0, 3.3, 5.0, 3.1, 0.0, 0.8],
                    [4.7, 0.7, 5.6, 2.6, 2.2, 6.2, 3.0],
                    [1.3, 5.2, 2.0, 5.5, 5.9, 3.2, 5.1],
                    [0.1, 2.0, 5.0, 1.4, 5.0, 1.9, 6.3]])

plt.figure()
plt.imshow(imm)
plt.gray()
plt.colorbar()
plt.title('Monochrome Or Grayscale ImAgE')
plt.show()
Output:
Output is as figure
Advertisement
Advertisement