Home »
Python »
Python Data Visualization
Python | Hatching the area between two curves
In this article, we are going to learn how to apply hatching for the area between two curves in x-y plot using matplotlib in Python?
Submitted by Anuj Singh, on September 01, 2020
Matplotlib has an inbuilt defined function for applying hatching to the area between two curves. Following example tries to do our desired operation with three different types of hatching.
plt.text(0.45, 0.45, r'$\biguplus$')
Illustrations:
Python code for hatching the area between two curves
import numpy as np
import matplotlib.pyplot as plt
#Definiing Curves
x = np.arange(40)
y = 4 + x**2
yy = x**2.05 + 29*x
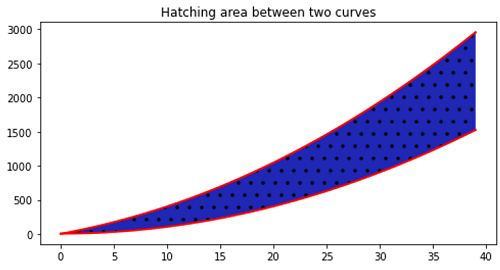
#Hathing Area
plt.figure(figsize=(8,4))
plt.fill_between(x, y, yy, hatch='.')
plt.plot(x,y, linewidth=2.0, color='red')
plt.plot(x,yy, linewidth=2.0, color='red')
plt.title('Hatching area between two curves')
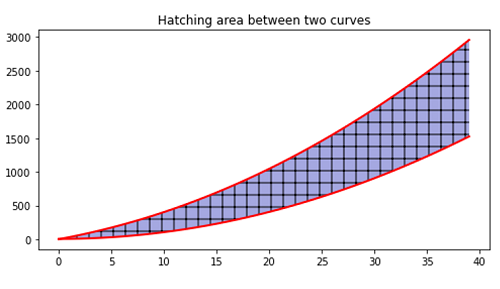
#Hathing Area
plt.figure(figsize=(8,4))
plt.fill_between(x, y, yy, alpha=0.4, hatch='+')
plt.plot(x,y, linewidth=2.0, color='red')
plt.plot(x,yy, linewidth=2.0, color='red')
plt.title('Hatching area between two curves')
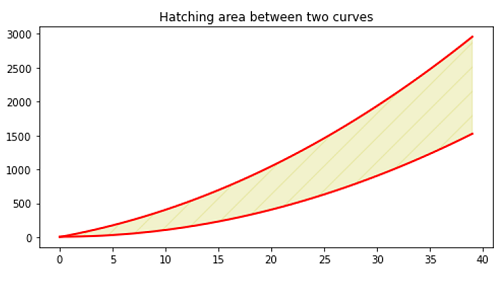
#Hathing Area
plt.figure(figsize=(8,4))
plt.fill_between(x, y, yy, color='y', alpha=0.2, hatch='/')
plt.plot(x,y, linewidth=2.0, color='red')
plt.plot(x,yy, linewidth=2.0, color='red')
plt.title('Hatching area between two curves')
Output:
Output is as Figure
Advertisement
Advertisement