Home »
Python »
Python Data Visualization
Python | Hex Color Code in Matplotlib
In this article, we are going to plot lines using multiple colors (by hex color code) available in Python matplotlib.
Submitted by Anuj Singh, on August 27, 2020
Illustrations:
Python code for hex color code in matplotlib
from cycler import cycler
import numpy as np
import matplotlib as mpl
import matplotlib.pyplot as plt
# Define a list of markevery cases and
# color cases to plot
cases = [None,
8,
(30, 8),
[16, 24, 30],
[0, -1],
slice(100, 200, 3),
0.1,
0.3,
1.5,
(0.0, 0.1),
(0.45, 0.1)]
colors = ['#1f27b4',
'#ff1f0e',
'#2ca02c',
'#d69728',
'#9497bd',
'#8c564b',
'#e377c2',
'#7f7f5f',
'#bcbd72',
'#17becf',
'#1a55FF']
mpl.rcParams['axes.prop_cycle'] = cycler(markevery=cases, color=colors)
x = np.linspace(0, 2 * np.pi)
offsets = np.linspace(0, 2 * np.pi, 11, endpoint=False)
yy = np.transpose([np.sin(x + phi) for phi in offsets])
# Plotting
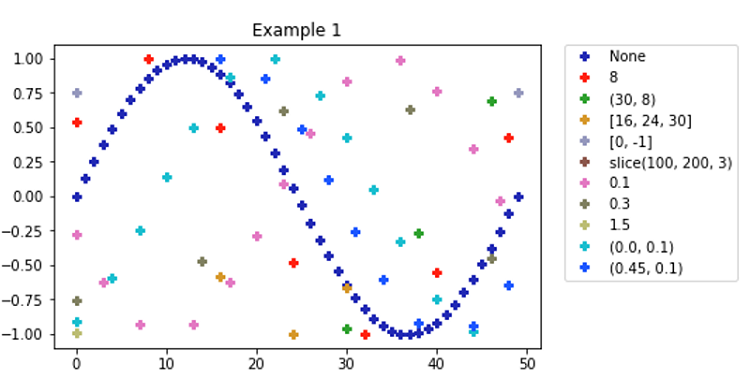
# Example 1
fig = plt.figure(figsize=(8,4))
ax = fig.add_axes([0.1, 0.1, 0.6, 0.75])
for i in range(len(cases)):
ax.plot(yy[:, i], 'P', label=str(cases[i]))
ax.legend(bbox_to_anchor=(1.05, 1), loc='upper left', borderaxespad=0.)
plt.title('Example 1')
plt.show()
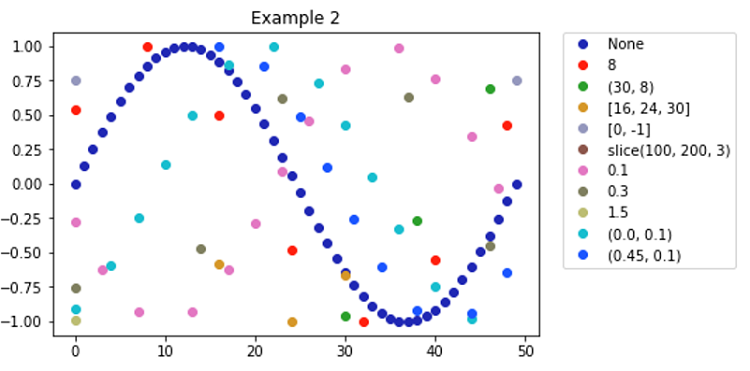
# Example 2
fig = plt.figure(figsize=(8,4))
ax = fig.add_axes([0.1, 0.1, 0.6, 0.75])
for i in range(len(cases)):
ax.plot(yy[:, i], 'o', label=str(cases[i]))
ax.legend(bbox_to_anchor=(1.05, 1), loc='upper left', borderaxespad=0.)
plt.title('Example 2')
plt.show()
#Example 3
fig = plt.figure(figsize=(8,4))
ax = fig.add_axes([0.1, 0.1, 0.6, 0.75])
for i in range(len(cases)):
ax.plot(yy[:, i], '-x', label=str(cases[i]))
ax.legend(bbox_to_anchor=(1.05, 1), loc='upper left', borderaxespad=0.)
plt.title('Example 2')
plt.show()
# Example 4
fig = plt.figure(figsize=(8,4))
ax = fig.add_axes([0.1, 0.1, 0.6, 0.75])
for i in range(len(cases)):
ax.plot(yy[:, i], marker='x', linewidth=0.6, label=str(cases[i]))
ax.legend(bbox_to_anchor=(1.05, 1), loc='upper left', borderaxespad=0.)
plt.title('Example 2')
plt.show()
Output:
Output is as Figure
Advertisement
Advertisement