Home »
Python »
Python Data Visualization
Horizontal Broken Bar Graph in Python using Matplotlib
In this tutorial, we are going to learn how to plot a horizontal broken bar graph using matplotlib in Python?
Submitted by Anuj Singh, on August 14, 2020
Illustration:


Python code for horizontal broken bar graph using matplotlib
#Data Visualization using Python
#Horizontal Broken Bar Graph
import numpy as np
import matplotlib.pyplot as plt
N = 8
x = np.array([1,2,3,4,5,6,7,9])
xx = np.array(['a','b','c','d','e','f','g','u'])
y = np.random.rand(N)*5
yy = 5 + np.random.rand(N)
# a normal bar plot with default features
plt.barh(x, y, left=yy )
plt.xlabel('Numbers')
plt.ylabel('Values')
plt.xlim(3,10)
plt.title('Normal broken bar Plot')
plt.show()
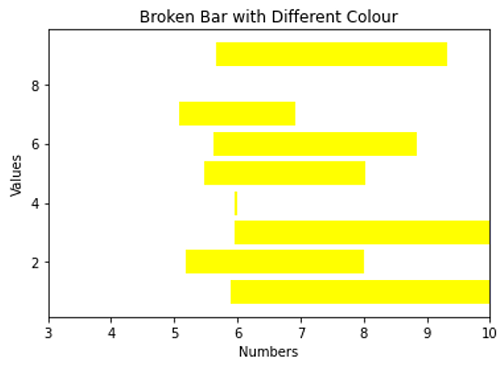
# a bar plot with green collour
plt.figure()
plt.barh(x, y, color='yellow', left=yy)
plt.xlabel('Numbers')
plt.ylabel('Values')
plt.xlim(3,10)
plt.title('Broken Bar with Different Colour')
plt.show()
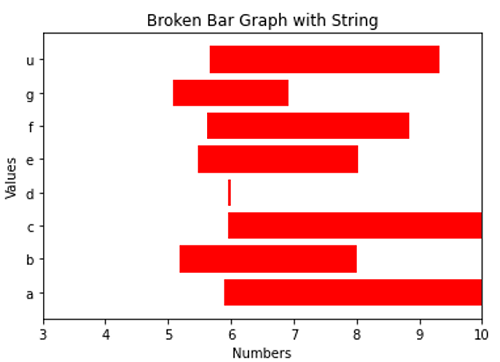
# a bar plot with string points
plt.figure()
plt.barh(xx, y, color='red', left=yy)
plt.xlabel('Numbers')
plt.xlim(3,10)
plt.ylabel('Values')
plt.title('Broken Bar Graph with String')
plt.show()
# A combined bar Plot
plt.figure()
plt.barh(np.arange(26), np.random.randint(0,50,26), alpha = 0.6, left=np.random.randint(0,50,26))
plt.xlabel('Numbers')
plt.ylabel('Values')
plt.title('Broken Bar : Random Plot')
plt.show()
Output:
Output is as Figure
Advertisement
Advertisement