Home »
Python »
Python Data Visualization
Python | Horizontal Hatch Spanning Plot
Here, we are going to learn about the horizontal hatch spanning plot and its Python implementation?
Submitted by Anuj Singh, on July 22, 2020
In this article, we are going to learn how to add a horizontal Hatch-spanning in matplotlib figures? Hatch Spanning can be used for setting background and also can be used for separating spaces in the plot. It is rarely used but still can be an essential technique for plotting.
The following example illustrates four possible examples for developing a basic understanding of implementation.
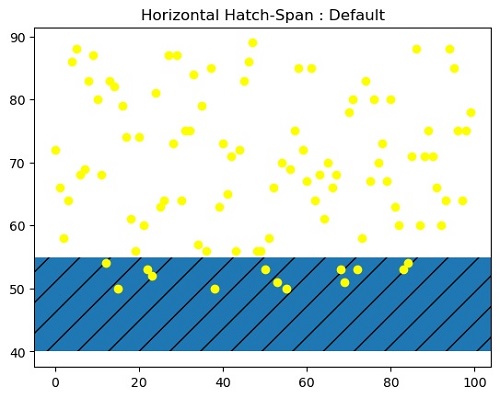
plt.plot(x,y, 'o', color='yellow')
plt.axhspan(ymin=40, ymax=55, hatch='/')

Python code for horizontal hatch spanning plot
import numpy as np
import matplotlib.pyplot as plt
x = np.arange(100)
y = np.random.randint(50,90,100)
#Figure 1
plt.figure()
plt.plot(x,y, 'o', color='yellow')
plt.axhspan(ymin=40, ymax=55, hatch='/')
plt.title('Horizontal Hatch-Span : Default')
plt.show()
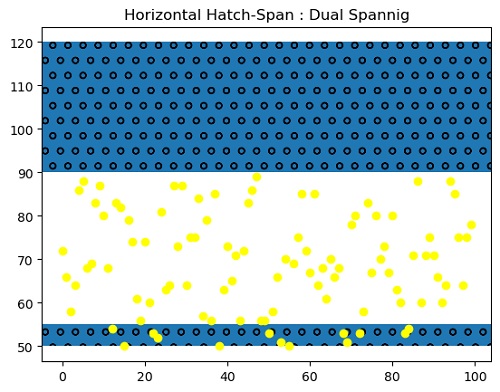
#Figure 2
plt.figure()
plt.plot(x,y, 'o', color='yellow')
plt.axhspan(50, 55, hatch='o')
plt.axhspan(90, 120, hatch='o')
plt.title('Horizontal Hatch-Span : Dual Spannig')
plt.show()
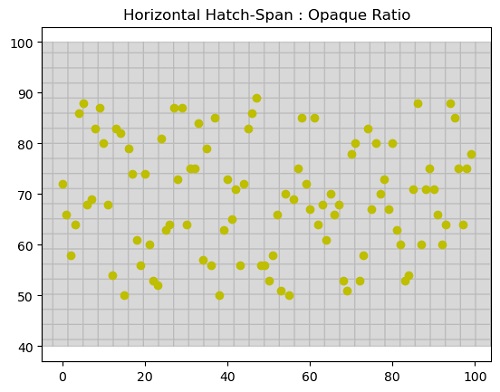
#Figure 3
plt.figure()
plt.plot(x,y, 'o', color='y')
plt.axhspan(ymin=40, ymax=100, color='grey', hatch='+', alpha=0.3)
plt.title('Horizontal Hatch-Span : Opaque Ratio')
plt.show()
#figure 4
plt.figure()
plt.plot(x,y, 'o', color='y')
plt.ylim(30,130)
plt.axhspan(ymin=60, ymax=100, color='grey', hatch='-', alpha=0.3)
plt.title('Horizontal Hatch-Span : Opaque Ratio')
plt.show()
Output:
Output is as figure
Advertisement
Advertisement