Home »
Python »
Python Data Visualization
Horizontal Span in Python Plot
matplotlib.pyplot.axhspan(): Here, we are going to learn how to add a horizontal span in matplotlib figures (Python plots)?
Submitted by Anuj Singh, on July 23, 2020
A horizontal span is required for marking bounded areas and is mostly used in business presentation plots. In some cases, it is also used for defining outliers, and therefore, it turns out to be a good technique in data visualization, and therefore, matplotlib has an inbuilt defined function for our operation, matplotlib.pyplot.axhspan().
The following example illustrates all four possible examples.
Illustration:
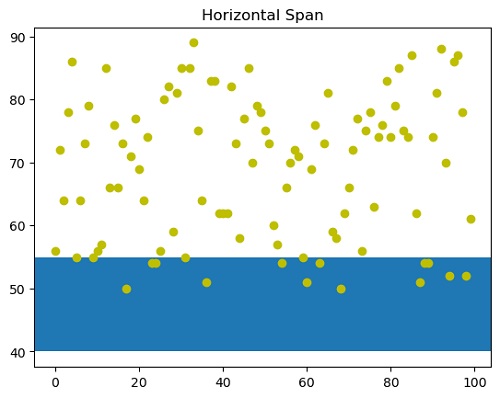
plt.plot(x,y, 'o', color='y')
plt.axhspan(40, 55)
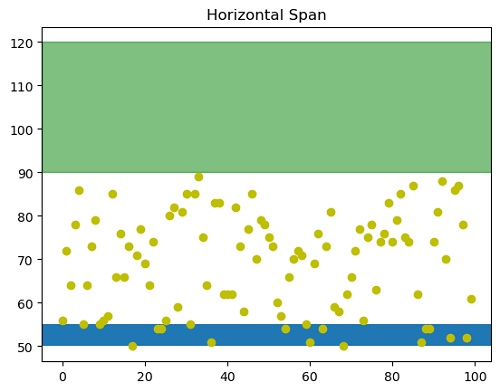
plt.plot(x,y, 'o', color='y')
plt.axhspan(50, 55)
plt.axhspan(90, 120, color='green', alpha=0.5)
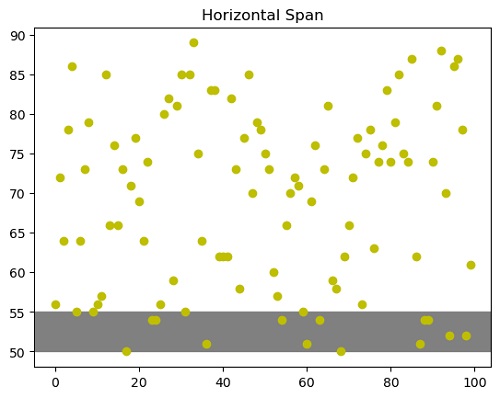
plt.plot(x,y, 'o', color='y')
plt.axhspan(50, 55, color='grey')
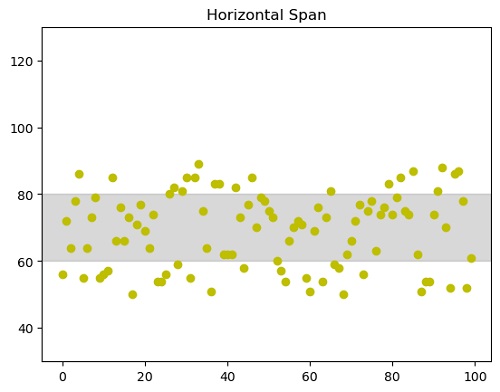
plt.ylim(30,130)
plt.axhspan(ymin=60, ymax=80, color='grey', alpha=0.3)
Python code for horizontal span in the plot
import numpy as np
import matplotlib.pyplot as plt

x = np.arange(100)
y = np.random.randint(50,90,100)

#figure1
plt.figure()
plt.plot(x,y, 'o', color='y')
plt.axhspan(40, 55)
plt.title('Horizontal Span')
plt.show()

#Figure 2
plt.figure()
plt.plot(x,y, 'o', color='y')
plt.axhspan(50, 55)
plt.axhspan(90, 120, color='green', alpha=0.5)
plt.title('Horizontal Span')
plt.show()

#Figure 3
plt.figure()
plt.plot(x,y, 'o', color='y')
plt.axhspan(50, 55, color='grey')
plt.title('Horizontal Span')
plt.show()

#figure 4
plt.figure()
plt.plot(x,y, 'o', color='y')
plt.ylim(30,130)
plt.axhspan(ymin=60, ymax=80, color='grey', alpha=0.3)
plt.title('Horizontal Span')
plt.show()
Output:
Output is as figure
Advertisement
Advertisement