Home »
Python »
Python Programs »
Python Matplotlib Programs
How to place the legend outside the plot in matplotlib?
In this tutorial, we will learn how to place the legend outside the plot in Matplotlib.
By Pranit Sharma Last updated : July 11, 2023
Legend is an identification symbol that describes the elements of the plot. For example, if a graph contains two coloured plots i.e., red, and blue, then two legends can be used to describe that what does each plot represents.
Placing legend in matplotlib with default position
To place the visually appealing legends in matplotlib, we need to follow a few easy steps:
- Create a plot using the plot() function from matplotlib.pyplot module.
- Add a label to the plot. Labels represent the name of the plot for the x and y axis respectively.
- Use the legend() function to add a legend. When we use this function, the two labels get encapsulated as a single indicator to represent the x and y axis.
Example
# Import matplotlib pyplot
import matplotlib.pyplot as plt

# Import numpy
import numpy as np

# Preparing some data
x = np.arange(0, 11)

# Creating plot with labels
plt.plot(x, x**2, label="x square")
plt.plot(x, x**3, label="x cube")

# Adding legend
plt.legend()

# Display plot
plt.show()
Output:
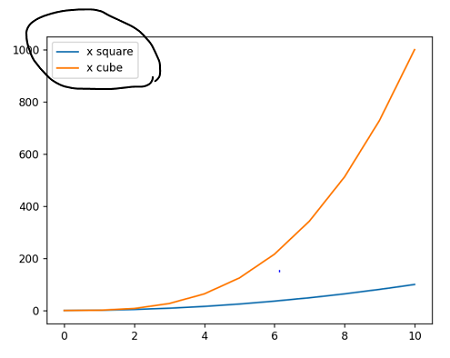
In the above example, we have added the two legends representing x-square for blue plot and x-cube for red plot.
We can see that these legends are added inside the plot by default and hence it may collide or overlap the plot figure for some other dataset. For this reason, we sometimes adjust the legend placement in matplotlib.
Placing legend outside the plot
Positioning the legend outside the plot is important to enhance plot visibility and fine analytics. For this purpose, we can move the legend outside the plot by defining the custom legend position. Here is a step-by-step approach.
- Use bbox_to_anchor() inside the legend() function in conjunction with loc to define the location.
- The bbox_to_anchor() function can be provided with a 2-tuple or 4-tuple of float values.
- If a 2-tuple is provided, it represents the coordinates of the legend within the plot. If a 4-tuple is provided, it represents the coordinates of the legend box along with its width and height.
- We can set different positions to the loc parameter to adjust the position of the legend. These locations are best, upper right, upper left, lower left, lower right, right, center left, center, right, lower center, upper center, and center.
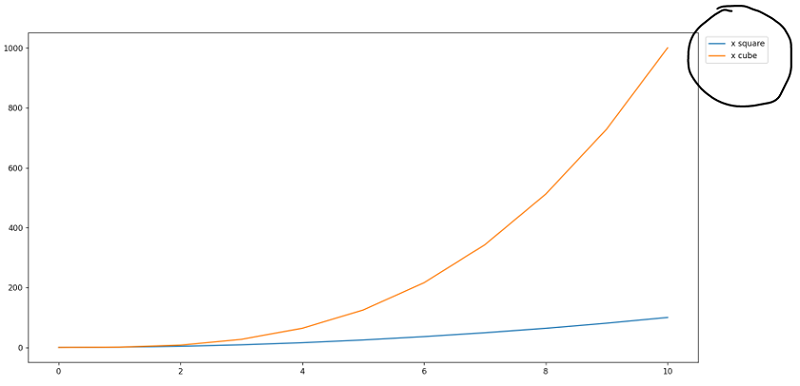
Example 1: Placing the legend to upper right
# Import matplotlib pyplot
import matplotlib.pyplot as plt

# Import numpy
import numpy as np

# Preparing some data
x = np.arange(0, 11)

# Creating plot with labels
plt.plot(x, x**2, label="x square")
plt.plot(x, x**3, label="x cube")

# Adding legend
plt.legend(bbox_to_anchor=(1.11, 1.0), loc="upper right")

# Display plot
plt.show()
Output:
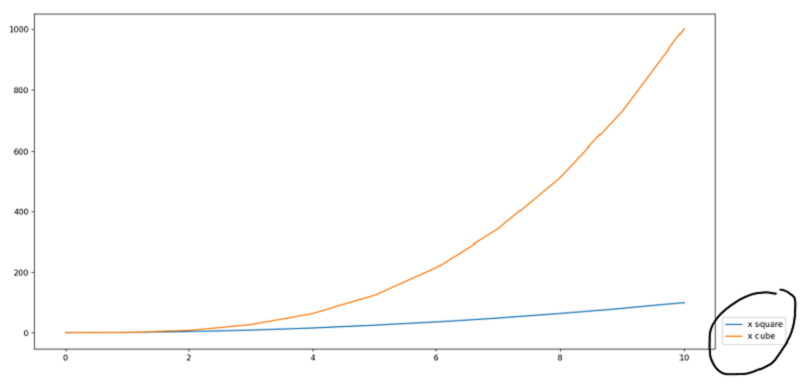
Example 2: Placing the legend to lower right
# Import matplotlib pyplot
import matplotlib.pyplot as plt

# Import numpy
import numpy as np

# Preparing some data
x = np.arange(0, 11)

# Creating plot with labels
plt.plot(x, x**2, label="x square")
plt.plot(x, x**3, label="x cube")

# Adding legend
plt.legend(bbox_to_anchor=(1.11, 0.0001), loc="lower right")

# Display plot
plt.show()
Output:
Advertisement
Advertisement