Home »
Python »
Python Data Visualization
Python | Legend Locations
Python | Legend Locations: Here, we will learn about the legend locations and its Python implementation.
Submitted by Anuj Singh, on July 14, 2020
Legends are one of the key components of data visualization and plotting. Matplotlib can automatically define a position for a legend in addition to this, it allows us to locate it in our required positions. Following is the list of locations on which we can locate our plot legend.
Python code for legend locations
# Data Visualization using Python
# Adding a Legend Location
import numpy as np
import matplotlib.pyplot as plt
x = np.linspace(0, 2, 100)
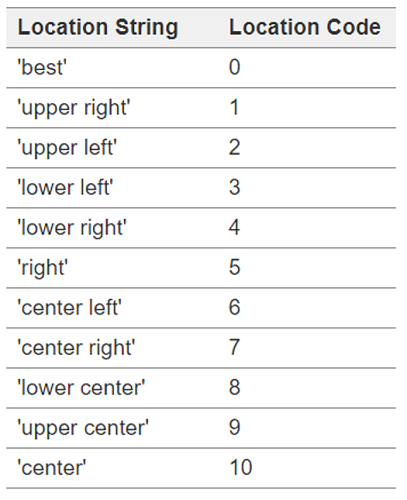
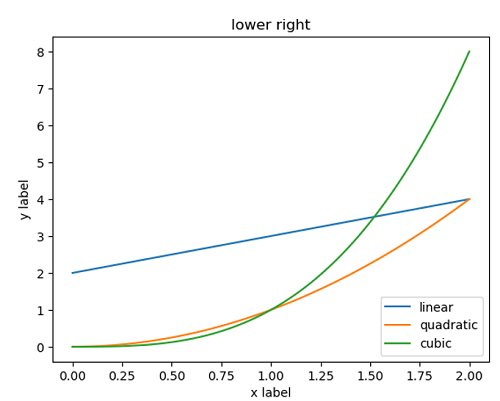
# Example 1
plt.figure()
plt.plot(x, x+2, label='linear')
plt.plot(x, x**2, label='quadratic')
plt.plot(x, x**3, label='cubic')
plt.xlabel('x label')
plt.ylabel('y label')
plt.title("lower right")
plt.legend(loc='lower right')
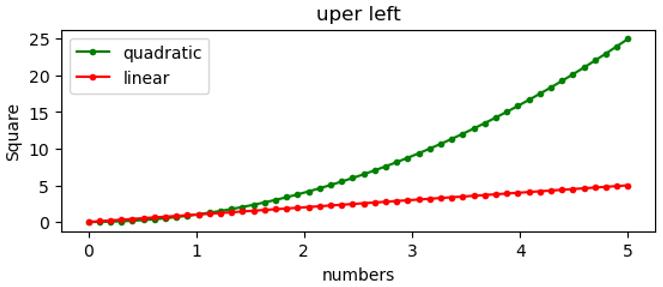
# Example 2
plt.figure()
x = np.linspace(0.0, 5.0)
y = x*x
plt.subplot(2, 1, 2)
plt.plot(x, y, 'g.-',label='quadratic')
plt.plot(x,x, 'r.-', label='linear')
plt.title('uper left')
plt.xlabel('numbers')
plt.ylabel('Square')
plt.legend(loc='uper left')
plt.show()
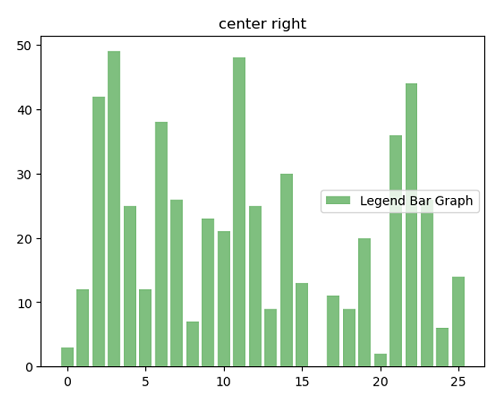
# Example 3
# Random Bar Graph Example
plt.figure()
plt.bar(np.arange(26), np.random.randint(0,50,26), alpha = 0.5, color='g', label='Legend Bar Graph')
plt.title('center right')
plt.legend(loc='center right')
Output:
Output is as figure
Advertisement
Advertisement