Home »
Python »
Python Data Visualization
Python | Linear vs Log vs Logit Scale
In this article, we are going to compare three different types of scales in Python plotting.
Submitted by Anuj Singh, on August 21, 2020
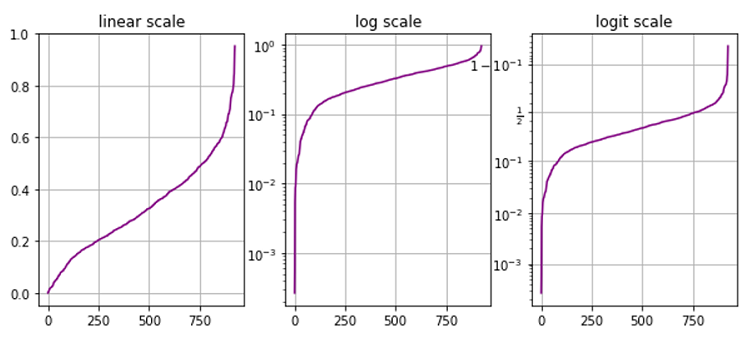
Matplotlib allows us to plot data with different scales and three of them are most commonly used that are linear log and logit. This article presents these three plots in a subplot where the data is being plotted on the same data. This will help us to understand the minor differences between these scales and it would act as a reference. All the plots are plot parallelly in a subplot and the grid is also being used for better and fine visualization.
Illustrations:

Python code for linear vs log vs logit scale
import matplotlib.pyplot as plt
import numpy as np

y = np.random.normal(loc=0.5, scale=0.4, size=1000)
y = y[(y > 0) & (y < 1)]
y.sort()
x = np.arange(len(y))

plt.figure(figsize=(10,4))
plt.subplot(131)
plt.plot(x, y, 'o', color='purple')
plt.title('linear scale')
plt.grid(True)

plt.subplot(132)
plt.plot(x, y, 'o', color='purple')
plt.yscale('log')
plt.title('log scale')
plt.grid(True)

plt.subplot(133)
plt.plot(x, y, 'o', color='purple')
plt.yscale('logit')
plt.title('logit scale')
plt.grid(True)
plt.show()

########################

y = np.random.normal(loc=0.3, scale=0.2, size=1000)
y = y[(y > 0) & (y < 1)]
y.sort()
x = np.arange(len(y))

plt.figure(figsize=(10,4))
plt.subplot(131)
plt.plot(x, y, color='purple')
plt.title('linear scale')
plt.grid(True)

plt.subplot(132)
plt.plot(x, y, color='purple')
plt.yscale('log')
plt.title('log scale')
plt.grid(True)

plt.subplot(133)
plt.plot(x, y, color='purple')
plt.yscale('logit')
plt.title('logit scale')
plt.grid(True)
plt.show()
Output:
Output is as Figure
Advertisement
Advertisement