Home »
Python »
Python Data Visualization
Python | Log Scale in Matplotlib
In this tutorial, we are going to change the scale of y axis from linear to log using matplotlib.
Submitted by Anuj Singh, on August 01, 2020
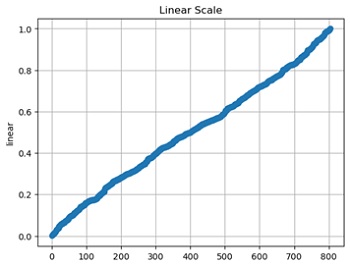
When we need to plot data in logarithmic form, then we can use an inbuilt defined function matplotlib.pyplot.yscale('log'). We have illustrated the usage using below example and also compared it with the linear scale in subplot.


Python code for log scale in matplotlib
import numpy as np
import matplotlib.pyplot as plt

y = np.random.normal(loc=0.5, scale=0.4, size=1000)
y = y[(y > 0) & (y < 1)]
y.sort()
x = np.arange(len(y))

plt.figure()
plt.plot(x,y, 'o')
plt.title('Linear Scale')
plt.ylabel('linear')
plt.grid()
plt.show()

plt.figure()
plt.plot(x,y, 'o')
plt.title('Log Scale')
plt.yscale('log')
plt.ylabel('log')
plt.grid()
plt.show()

plt.figure(figsize=(10,5))
plt.subplot(121)
plt.plot(x,y, 'o')
plt.title('Linear Scale')
plt.ylabel('linear')
plt.grid()

plt.subplot(122)
plt.plot(x,y, 'o')
plt.title('Log Scale')
plt.yscale('log')
plt.ylabel('log')
plt.grid()
plt.show()
Output:
Output is as figure
Advertisement
Advertisement