Home »
Python »
Python Data Visualization
Notched Box Plot in Python using Matplotlib
Here, we are going to learn about the notched box plot in python using matplotlib and its Python implementation.
Submitted by Anuj Singh, on August 10, 2020
Making a box plot or whisker plot for each column of x (if x is a matrix) or vector x includes creating a box that extends from the lower quartile to upper quartile values of data. It also has a line right at the median of the datapoint (each column of the matrix in the case of the matrix). It also includes outliers as fliers points and is represented by dots. In this way, it helps in visualizing the definitive range of data and therefore it is important to get to know about how we can plot BoxPlot in python. There is a subtype of boxplot in which edges in the middle of the box are bent inside. Such a box plot is called the Notched Box plot. Matplot has an inbuilt defined function with a command notch for Box-Plot i.e. matplotlib.pyplot.boxplot().
The following example illustrates the basic example of the Box Plot.
Python code for notched box plot using matplotlib
import numpy as np
import matplotlib.pyplot as plt
# Generating Data
spread = np.random.rand(65) * 82
center = np.ones(36) * 50
flier_high = np.random.rand(12) * 100 + 100
flier_low = np.random.rand(10) * -100
data = np.concatenate((spread, center, flier_high, flier_low))
plt.figure()
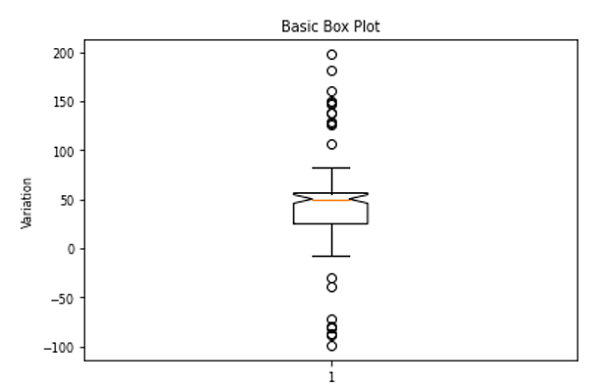
plt.title('Notched Box Plot')
plt.boxplot(data, notch=True)
plt.ylabel('Variation')
Output:
Output is as Figure
Advertisement
Advertisement