Home »
Python »
Python Data Visualization
Python | Plotting Coherence
Python | Plotting Coherence: Here, we will learn about the plotting coherence and its Python implementation.
Submitted by Anuj Singh, on July 14, 2020
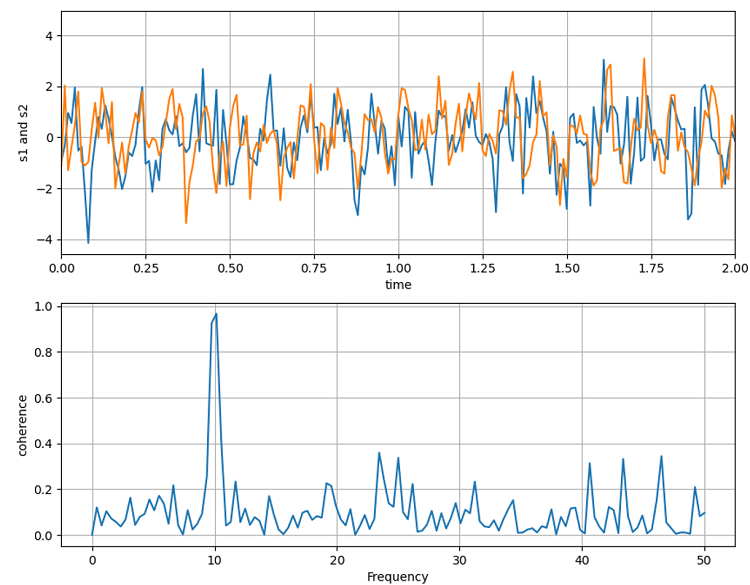
With many applications, coherence is an important part of Physics and other subjects too. Therefore, Matplotlib allows us to plot the coherence between two signals using the pyplot package. In this example, we are going to generate two random signals using a NumPy random package and then plot them. For coherence between two signals, the plotting is done by vertical sub plotting for better visualization.
Python code for plotting coherence
import numpy as np
import matplotlib.pyplot as plt

dt = 0.01
t = np.arange(0, 30, dt)
nse1 = np.random.randn(len(t)) # white noise 1
nse2 = np.random.randn(len(t)) # white noise 2

# Two signals with a coherent part
# at 10Hz and a random part
s1 = np.sin(2 * np.pi * 10 * t) + nse1
s2 = np.sin(2 * np.pi * 10 * t) + nse2

plt.figure(figsize=(10,8))
plt.subplot(211)
plt.plot(t, s1, t, s2)
plt.xlim(0, 2)
plt.xlabel('time')
plt.ylabel('s1 and s2')
plt.grid(True)

plt.subplot(212)
plt.cohere(s1, s2, 256, 1. / dt)
plt.ylabel('coherence')
plt.show()
Output:
Output is as figure
Advertisement
Advertisement