Home »
Python »
Python Data Visualization
Python | Plotting Trigonometric Functions
In this article, we are going to learn about the various plotting trigonometric functions and their Python implementations.
Submitted by Anuj Singh, on July 15, 2020
Trigonometry is one of the most important parts in engineering and many times, therefore matplotlib.pyplot in combination with NumPy can help us to plot our desired trigonometric functions. In this article, we are going to introduce a few examples of trig-functions.
1) Sine Function
s = np.sin(t)
fig, ax = plt.subplots()
ax.plot(t, s)
ax.set(xlabel='radians', ylabel='Sin(x)',
       title='Sine Plot')
ax.grid()
plt.show()

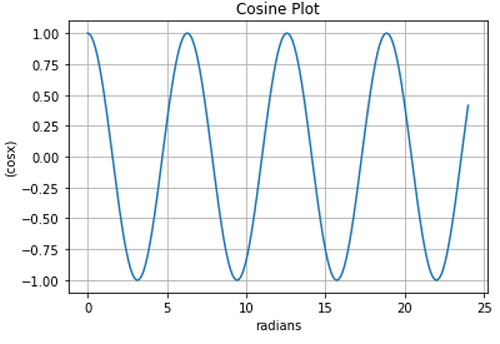
2) Cosine Function
s = np.cos(t)
fig, ax = plt.subplots()
ax.plot(t, s)
ax.set(xlabel='radians', ylabel='(cosx)',
       title='Cosine Plot')
ax.grid()
plt.show()
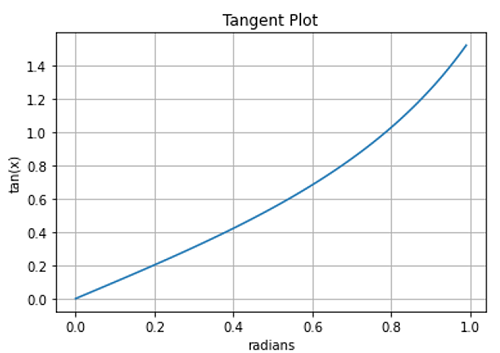
3) Tangent Function
t = np.arange(0.0, 1, 0.01)
s = np.tan(t)
fig, ax = plt.subplots()
ax.plot(t, s)
ax.set(xlabel='radians', ylabel='tan(x)',
       title='Tangent Plot')
ax.grid()
plt.show()
Python program for plotting trigonometric functions
import matplotlib.pyplot as plt
import numpy as np

# Data for plotting
t = np.arange(0.0, 24, 0.01)

# Sine Plot
s = np.sin(t)
fig, ax = plt.subplots()
ax.plot(t, s)
ax.set(xlabel='radians', ylabel='Sin(x)',
       title='Sine Plot')
ax.grid()
plt.show()

# Cosine Plot
s = np.cos(t)
fig, ax = plt.subplots()
ax.plot(t, s)
ax.set(xlabel='radians', ylabel='(cosx)',
       title='Cosine Plot')
ax.grid()
plt.show()

# Tangent Plot
t = np.arange(0.0, 1, 0.01)
s = np.tan(t)
fig, ax = plt.subplots()
ax.plot(t, s)
ax.set(xlabel='radians', ylabel='tan(x)',
       title='Tangent Plot')
ax.grid()
plt.show()
Output:
Output is as figure
Advertisement
Advertisement