Home »
Python »
Python Data Visualization
Remove the axis lines from the Python plot
matplotlib.pyplot.box(): Here, we are going to learn how to removes the axis lines from the Python plot?
Submitted by Anuj Singh, on July 23, 2020
Sometimes, we need to hide the axis and to overlay other widgets over the plot and avoid the mess in the figure. For this purpose, matplotlib has a defined function matplotlib.pyplot.box(). It removes the axis lines from the plot and performs our desired operation.
Illustration:
Python code to remove the axis lines from the plot
import numpy as np
import matplotlib.pyplot as plt
x = np.arange(50)
y = np.random.randint(45,55,50)
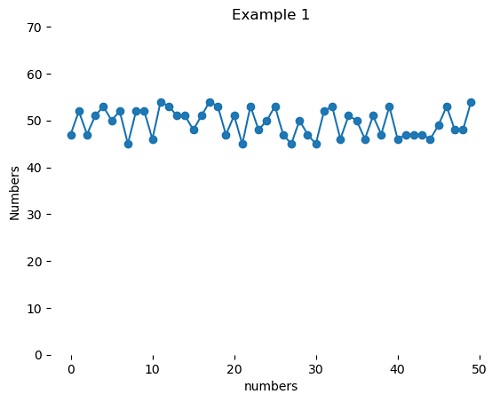
#Example 1
plt.figure()
plt.plot(x, y, 'o-')
plt.title('Example 1')
plt.ylabel('Numbers')
plt.xlabel('numbers')
plt.ylim(0,70)
plt.box()
plt.show()
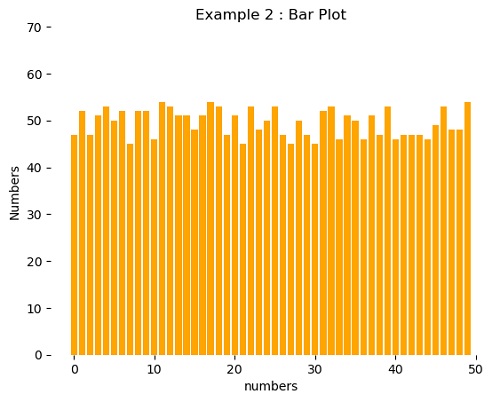
#Example 2
plt.figure()
plt.bar(x, y, color='orange')
plt.title('Example 2 : Bar Plot')
plt.xlabel('numbers')
plt.ylabel('Numbers')
plt.ylim(0,70)
plt.box()
plt.show()
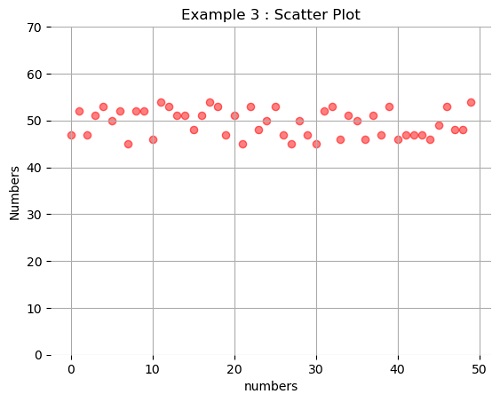
#Example 3
plt.figure()
plt.scatter(x, y, color='red', alpha=0.5)
plt.title('Example 3 : Scatter Plot')
plt.xlabel('numbers')
plt.ylabel('Numbers')
plt.ylim(0,70)
plt.grid()
plt.box()
plt.show()
Output:
Output is as figure
Advertisement
Advertisement