Home »
Python »
Python Data Visualization
Python | Scatter Symbol
Python | Scatter Symbol: In this article, we are going to learn about the Scatter Symbol and its Python implementation.
Submitted by Anuj Singh, on July 15, 2020
There are multiple types of Scatter Symbols available in the matplotlib package and can be accessed through the command marker. In this article, we will show some examples of different marker types and also present a list containing all the markers as defined by matplotlib.
Available Markers:
markers = {'.': 'point', ',': 'pixel', 'o': 'circle', 'v': 'triangle_down',
'^': 'triangle_up', '<': 'triangle_left', '>': 'triangle_right',
'1': 'tri_down', '2': 'tri_up', '3': 'tri_left', '4': 'tri_right',
'8': 'octagon', 's': 'square', 'p': 'pentagon', '*': 'star',
'h': 'hexagon1', 'H': 'hexagon2', '+': 'plus', 'x': 'x',
'D': 'diamond', 'd': 'thin_diamond', '|': 'vline', '_': 'hline',
'P': 'plus_filled', 'X': 'x_filled', 0: 'tickleft', 1: 'tickright',
2: 'tickup', 3: 'tickdown', 4: 'caretleft', 5: 'caretright',
6: 'caretup', 7: 'caretdown', 8: 'caretleftbase', 9: 'caretrightbase',
10: 'caretupbase', 11: 'caretdownbase',
'None': 'nothing', None: 'nothing', ' ': 'nothing', '': 'nothing'}
Reference: matplotlib.markers.MarkerStyle
Python code for scatter symbol
import matplotlib.pyplot as plt
import numpy as np
x = np.arange(0.0, 50.0, 2.0)
y = x ** 1.3 + np.random.rand(*x.shape) * 30.0
s = np.random.rand(*x.shape) * 300 + 500
plt.figure()
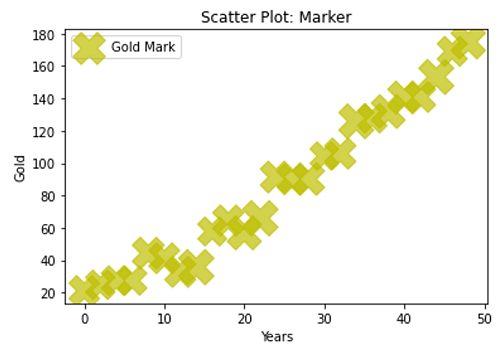
plt.scatter(x, y, s, c="y", alpha=0.7, marker='X',
label="Gold Mark")
plt.xlabel("Years")
plt.ylabel("Gold")
plt.title('Scatter Plot: Marker')
plt.legend()
plt.show()
plt.figure()
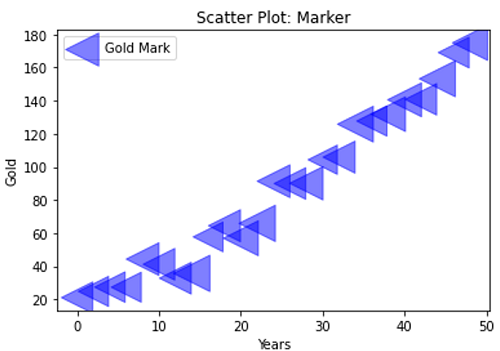
plt.scatter(x, y, s, c="b", alpha=0.5, marker='<',
label="Gold Mark")
plt.xlabel("Years")
plt.ylabel("Gold")
plt.title('Scatter Plot: Marker')
plt.legend()
plt.show()
plt.figure()
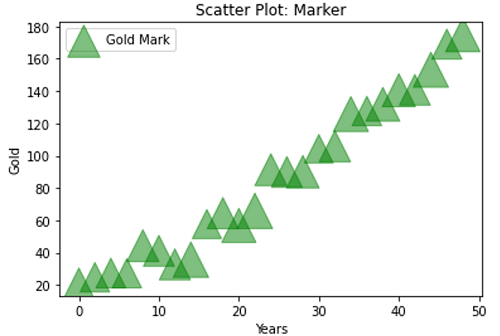
plt.scatter(x, y, s, c="g", alpha=0.5, marker='^',
label="Gold Mark")
plt.xlabel("Years")
plt.ylabel("Gold")
plt.title('Scatter Plot: Marker')
plt.legend()
plt.show()
plt.figure()
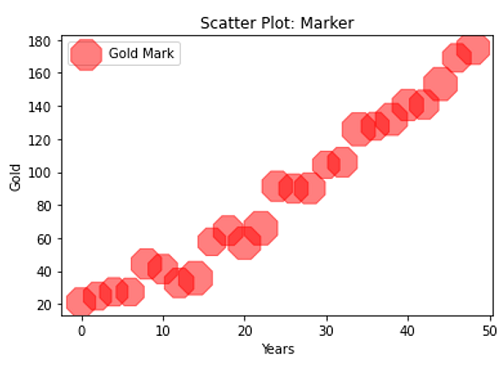
plt.scatter(x, y, s, c="r", alpha=0.5, marker='8',
label="Gold Mark")
plt.xlabel("Years")
plt.ylabel("Gold")
plt.title('Scatter Plot: Marker')
plt.legend()
plt.show()
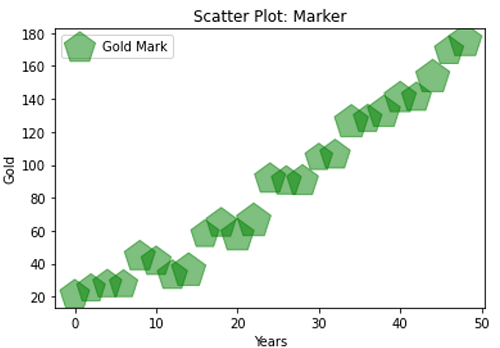
plt.figure()
plt.scatter(x, y, s, c="g", alpha=0.5, marker='p',
label="Gold Mark")
plt.xlabel("Years")
plt.ylabel("Gold")
plt.title('Scatter Plot: Marker')
plt.legend()
plt.show()
Output:
Output is as figure
Advertisement
Advertisement