Home »
Python »
Python Data Visualization
Python | Sine Curve Filling Example
In this article, we are going to learn how to fill the area between two sin/cos/trigonometric curves in x-y plot using matplotlib in Python?
Submitted by Anuj Singh, on August 28, 2020
Illustrations:
Python code for sine curve filling example
import numpy as np
import matplotlib.pyplot as plt
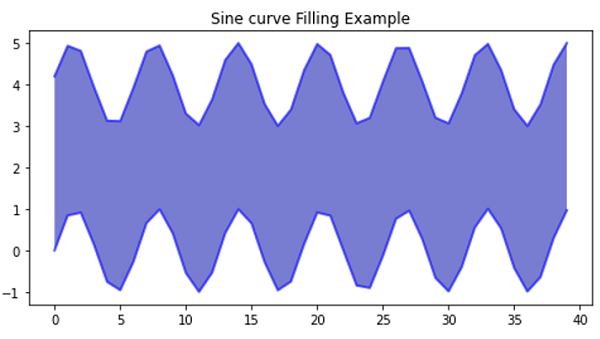
# Example 1
# Definiing Curves
x = np.arange(40)
y = np.sin(x)
yy = 4 + np.sin(x + 0.2)
# Filling Area
plt.figure(figsize=(8,4))
plt.fill_between(x, y, yy, alpha=0.6)
plt.plot(x,y, linewidth=2.0, color='blue', alpha=0.6)
plt.plot(x,yy, linewidth=2.0, color='blue', alpha=0.6)
plt.title('Sine curve Filling Example')
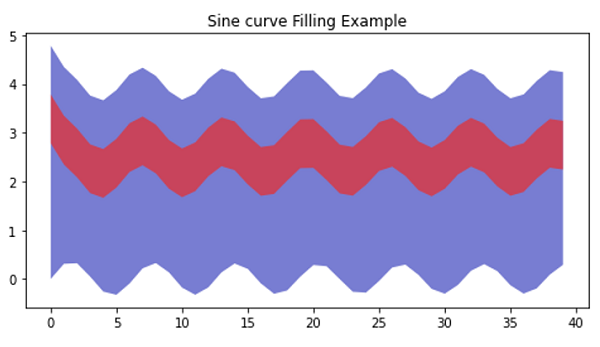
# Example 2
# Definiing Curves
x = np.arange(40)
y = np.sin(x)*np.exp(-x**0.05)
yy = 4 + np.sin(x + 0.9)*np.exp(-x**0.05)
y4 = 2 + np.sin(x + 0.9)*np.exp(-x**0.05)
y5 = 3 + np.sin(x + 0.9)*np.exp(-x**0.05)
# Filling Area
plt.figure(figsize=(8,4))
plt.fill_between(x, y, yy, alpha=0.6)
plt.fill_between(x, y4, y5, alpha=0.6)
plt.title('Sine curve Filling Example')
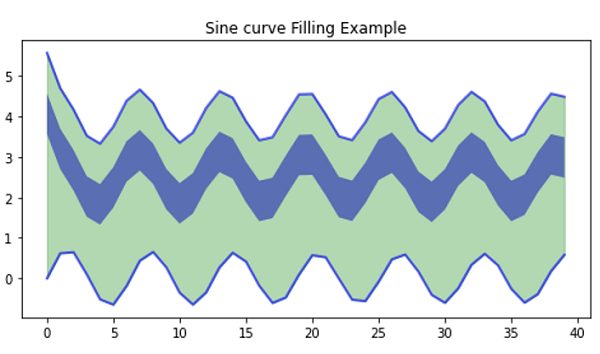
# Example 3
# Definiing Curves
x = np.arange(40)
y = 2*np.sin(x)*np.exp(-x**0.05)
yy = 4 + 2*np.sin(x + 0.9)*np.exp(-x**0.05)
y4 = 2 + 2*np.sin(x + 0.9)*np.exp(-x**0.05)
y5 = 3 + 2*np.sin(x + 0.9)*np.exp(-x**0.05)
# Filling Area
plt.figure(figsize=(8,4))
plt.fill_between(x, y, yy, color='green', alpha=0.3)
plt.fill_between(x, y4, y5, alpha=0.6)
plt.title('Sine curve Filling Example')
Output:
Output is as Figure
Advertisement
Advertisement