Home »
Python »
Python Data Visualization
Python | Step Line Plot vs Bar Plot
Step Line Plot vs Bar Plot in Python: In this tutorial, we are going to compare a Step-Line plot with Bar Plot (Bar Graph) using matplotlib.
Submitted by Anuj Singh, on August 03, 2020
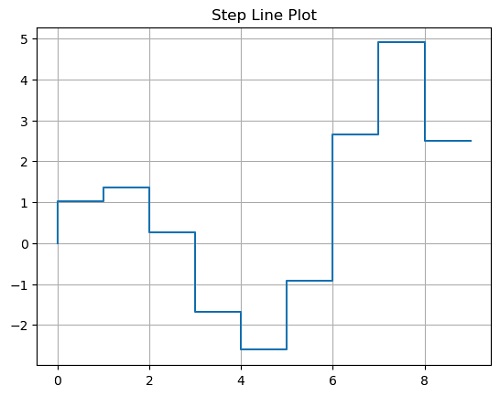
Step Line Plot
The Step Plot is one of the most used data visualization techniques used in the discrete analysis. It is a type of plot in which data are represented through steps and only the edge is shown. It is in the form of steps of stairs and therefore it is known as Step Line Plot.
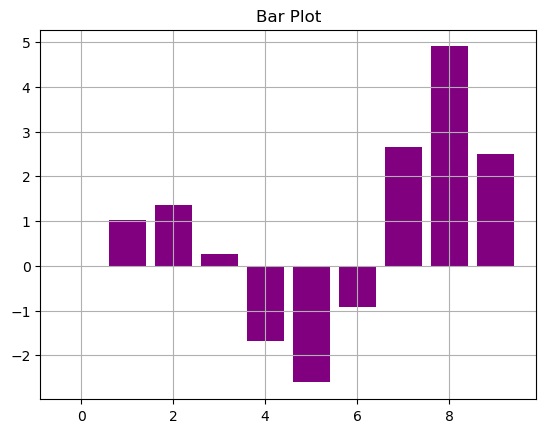
Bar Plot
A bar graph is a type of data visualization technique that is very often used to represent data in the form of a vertical bar. The height of the bar is proportional to the value. They allow us to compare data very clearly and therefore, bar graphs or bar charts are included in most of the presentations worldwide. A bar graph can be used to show comparisons between discrete classes and one of the two axes represents the specific categories that are being compared, and the other axis represents a measured value (for most of the cases, the y-axis represents the value and x-axis consist of discrete classes).
Python code for step line plot and bar plot
import numpy as np
import matplotlib.pyplot as plt
x = np.arange(10)
y = np.sin(x)*np.exp(x/5)
plt.figure()
plt.plot(x,y, ls='steps')
plt.title('Step Line Plot')
plt.grid()
plt.show()
plt.figure()
plt.bar(x,y, color= 'purple')
plt.title('Bar Plot')
plt.grid()
plt.show()
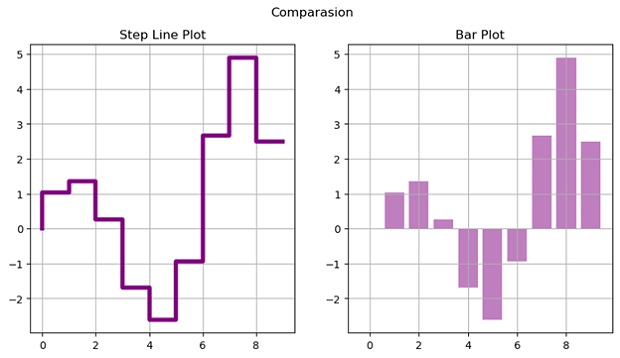
plt.figure(figsize=(10,5))
plt.subplot(121)
plt.plot(x,y, ls='steps', linewidth=4.0, color= 'purple')
plt.title('Step Line Plot')
plt.grid()
plt.subplot(122)
plt.bar(x,y, color= 'purple', alpha=0.5)
plt.title('Bar Plot')
plt.suptitle('Comparasion')
plt.grid()
plt.show()
Output:
Output is as figure
Advertisement
Advertisement