Home »
Python »
Python Data Visualization
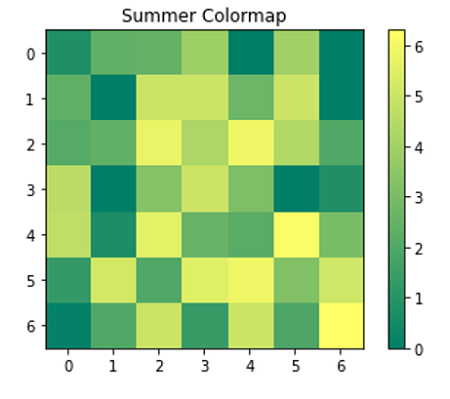
Summer Colormap for Plotting figure in Python
In this article, we are going to learn how to apply summer colormap in a Python figure using matplotlib?
Submitted by Anuj Singh, on August 14, 2020
Illustration:
Python code for Summer Colormap for Plotting figure
import numpy as np
import matplotlib.pyplot as plt

imm = np.array([[0.8, 2.4, 2.5, 3.9, 0.0, 4.0, 0.0],
                    [2.4, 0.0, 5.0, 5.0, 2.7, 5.0, 0.0],
                    [2.1, 2.4, 5.8, 4.3, 5.9, 4.4, 2.0],
                    [4.6, 0.0, 3.3, 5.0, 3.1, 0.0, 0.8],
                    [4.7, 0.7, 5.6, 2.6, 2.2, 6.2, 3.0],
                    [1.3, 5.2, 2.0, 5.5, 5.9, 3.2, 5.1],
                    [0.1, 2.0, 5.0, 1.4, 5.0, 1.9, 6.3]])

plt.figure()
plt.imshow(imm)
plt.summer()
plt.colorbar()
plt.title('Summer Colormap')
plt.show()
Output:
Output is as Figure
Advertisement
Advertisement