Home »
Python »
Python Data Visualization
Python | Sup-Title in Figure using Matplotlib
In this tutorial, we are going to learn how to add sup-title to a figure using matplotlib?
Submitted by Anuj Singh, on August 03, 2020
There is a function defined for our desired operation matplotlib.pyplot.suptitle().
Illustration:
Python code for sup-title in figure using matplotlib
import matplotlib.pyplot as plt
import numpy as np
#random data generation
mu, sigma = 100, 15
x = mu + sigma * np.random.randn(100)
mu_w = 200
sigma_w = 10
w = np.random.normal(mu_w, sigma_w, size=100)
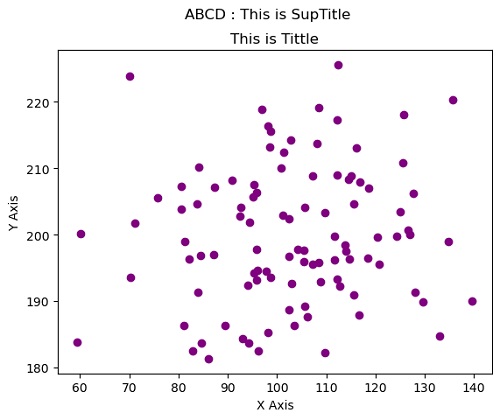
#Illustration 1
plt.plot(x,w, 'o', color='purple')
plt.suptitle('ABCD : This is SupTitle')
plt.xlabel('X Axis')
plt.ylabel('Y Axis')
plt.title('This is Tittle')
plt.show()
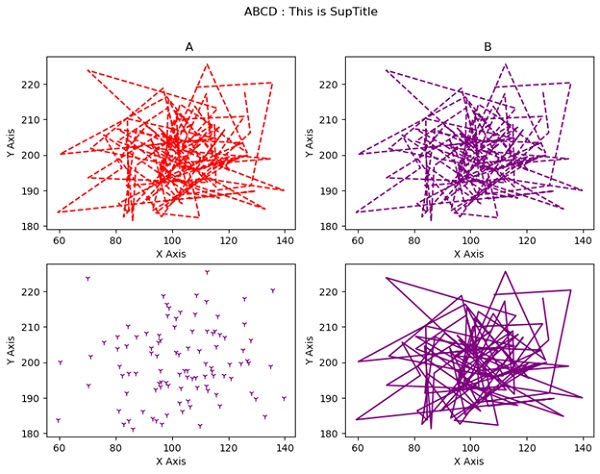
#Illustration 2
plt.figure(figsize=(10,7))
plt.suptitle('ABCD : This is SupTitle')
plt.subplot(221)
plt.plot(x,w, 'r--')
plt.xlabel('X Axis')
plt.ylabel('Y Axis')
plt.title(' A')
plt.subplot(222)
plt.plot(x,w, '--', color='purple')
plt.xlabel('X Axis')
plt.ylabel('Y Axis')
plt.title(' B')
plt.subplot(223)
plt.plot(x,w, '1', color='purple')
plt.xlabel('X Axis')
plt.ylabel('Y Axis')
plt.subplot(224)
plt.plot(x,w, '-', color='purple')
plt.xlabel('X Axis')
plt.ylabel('Y Axis')
plt.show()
Output:
Output is as figure
Advertisement
Advertisement