Home »
Python »
Python Data Visualization
Python | Text Box Styles in Matplotlib
Here, we are going to learn about the text box styles in matplotlib and its Python implementation.
Submitted by Anuj Singh, on July 19, 2020
In this tutorial, we are going to see the types of Text-Box styles (Square, Rounded, and Circle. We can manually set the textbox style by using bbox=dict(boxstyle=" ",) In this tutorial, we are going to see the types of Text-Box styles (Square, Rounded, and Circle. We can manually set the textbox style by using bbox=dict(boxstyle=" ",).
Following are the illustrations:
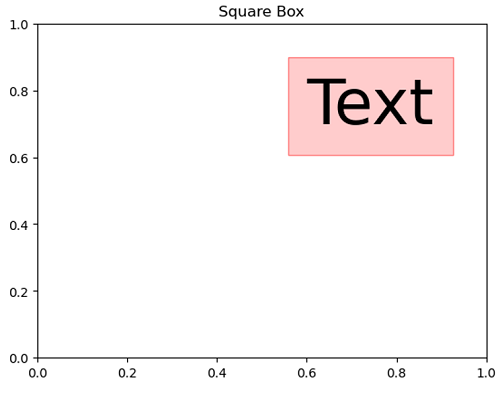
bbox=dict(boxstyle="square", ec=(1., 0.5, 0.5), fc=(1., 0.8, 0.8))
# Square textbox style
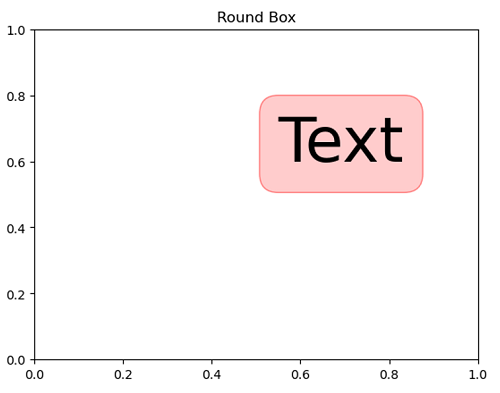
bbox=dict(boxstyle="round", ec=(1., 0.5, 0.5), fc=(1., 0.8, 0.8))
#round textbox style
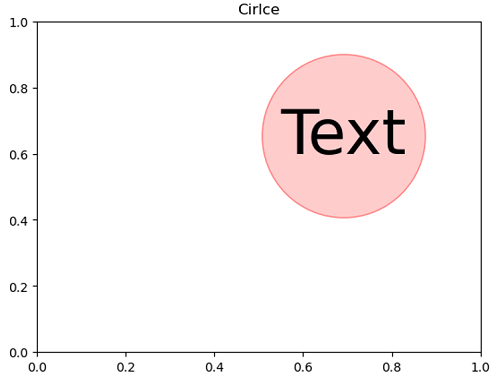
bbox=dict(boxstyle="circle", ec=(1., 0.5, 0.5), fc=(1., 0.8, 0.8))
#Circular textbox style
Python code for text box styles in matplotlib
import matplotlib.pyplot as plt

# Square
plt.figure()
plt.text(0.6, 0.7, "Text", size=50,
         bbox=dict(boxstyle="square",
                   ec=(1., 0.5, 0.5),
                   fc=(1., 0.8, 0.8),
                   )
         )
plt.title('Square Box')
plt.show()

# Rounded
plt.figure()
plt.text(0.55, 0.6, "Text", size=50,
         bbox=dict(boxstyle="round",
                   ec=(1., 0.5, 0.5),
                   fc=(1., 0.8, 0.8),
                   )
         )
plt.title('Round Box')
plt.show()


# Circle
plt.figure()
plt.text(0.55, 0.6, "Text", size=50,
         bbox=dict(boxstyle="circle",
                   ec=(1., 0.5, 0.5),
                   fc=(1., 0.8, 0.8),
                   )
         )
plt.title('Cirlce')
plt.show()
Output:
Output is as figure
Advertisement
Advertisement