Home »
Python »
Python Data Visualization
Python | Themeriver Stackplot using Matplotlib
In this tutorial, we are going to learn how to create a Theme River Plot in python using matplotlib?
Submitted by Anuj Singh, on August 03, 2020
From the family of stack plots, Theme River plot is a type where stack is generated with symmetry along the x=0 (x axis). Using Matplotlib command baseline='sym' in matplotlib.pyplot.stackplot will create a Theme-River Stack Plot.
Illustration:
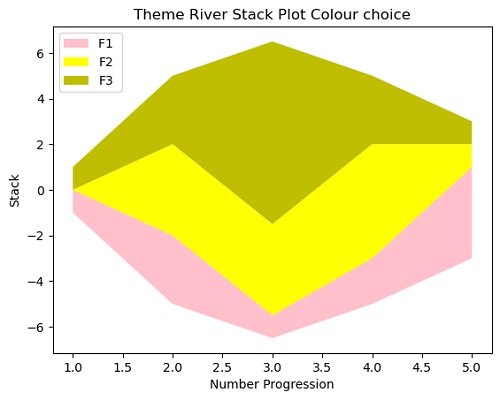
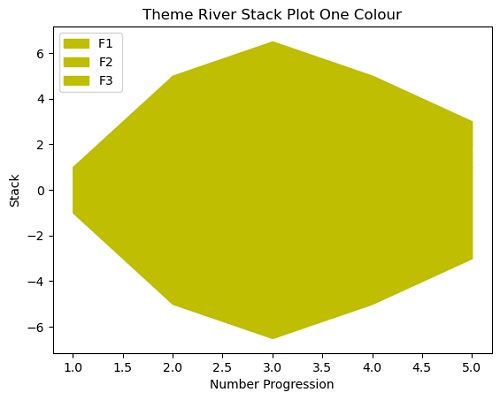
Example 1:

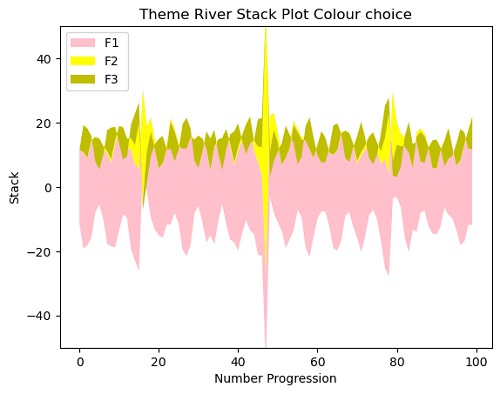
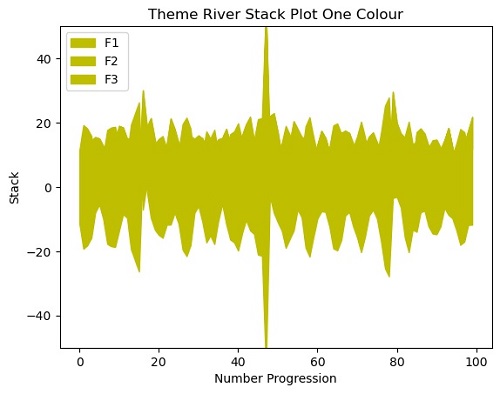
Example 2:

Python code for themeriver stackplot using matplotlib
import numpy as np
import matplotlib.pyplot as plt

x = np.arange(100)
y1 = np.random.randint(20,35,100)
y2 = np.tan(x/10)
y3 = np.sin(x)*10

y = np.vstack([y1, y2, y3])

labels = ["F1 ", "F2", "F3"]

####--------------------------------------####
####           Illustration 1             ####
plt.figure()
plt.stackplot(x, y1, y2, y3, labels=labels, baseline='sym')
plt.legend(loc='upper left')
plt.xlabel('Number Progression')
plt.ylabel('Stack')
plt.title('Theme River Stack Plot Example')
plt.ylim(-50,50)
plt.show()

plt.figure()
plt.stackplot(x, y1, y2, y3, labels=labels, baseline='sym', colors=['pink','yellow','y'])
plt.legend(loc='upper left')
plt.xlabel('Number Progression')
plt.ylabel('Stack')
plt.title('Theme River Stack Plot Colour choice')
plt.ylim(-50,50)
plt.show()

plt.figure()
plt.stackplot(x, y1, y2, y3, labels=labels, color='y',  baseline='sym')
plt.legend(loc='upper left')
plt.xlabel('Number Progression')
plt.ylabel('Stack')
plt.title('Theme River Stack Plot One Colour')
plt.ylim(-50,50)
plt.show()

####--------------------------------------####
####           Illustration 2             ####
x = [1, 2, 3, 4, 5]
y1 = [1, 3, 1, 2, 4]
y2 = [0, 4, 4, 5, 1]
y3 = [1, 3, 8, 3, 1]

y = np.vstack([y1, y2, y3])

labels = ["F1 ", "F2", "F3"]

plt.figure()
plt.stackplot(x, y1, y2, y3, labels=labels, baseline='sym')
plt.legend(loc='upper left')
plt.xlabel('Number Progression')
plt.ylabel('Stack')
plt.title('Theme River Stack Plot Example')
plt.show()

plt.figure()
plt.stackplot(x, y1, y2, y3, labels=labels, baseline='sym', colors=['pink','yellow','y'])
plt.legend(loc='upper left')
plt.xlabel('Number Progression')
plt.ylabel('Stack')
plt.title('Theme River Stack Plot Colour choice')
plt.show()

plt.figure()
plt.stackplot(x, y1, y2, y3, labels=labels, color='y',  baseline='sym')
plt.legend(loc='upper left')
plt.xlabel('Number Progression')
plt.ylabel('Stack')
plt.title('Theme River Stack Plot One Colour')
plt.show()
Output:
Output is as figure
Advertisement
Advertisement