Home »
Python »
Python Data Visualization
Python | Title Locations in Matplotlib
Here, we are going to learn about the title locations in matplotlib and its Python implementation.
Submitted by Anuj Singh, on August 04, 2020
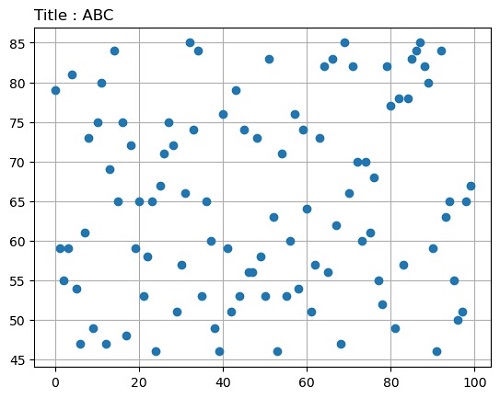
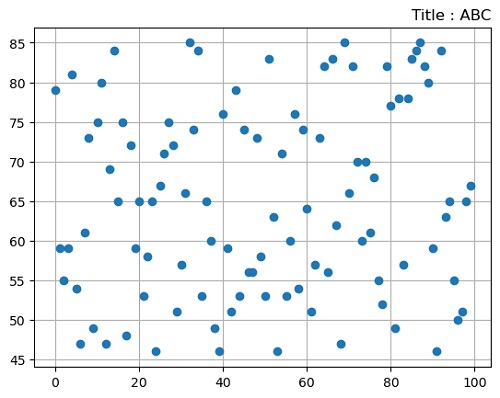
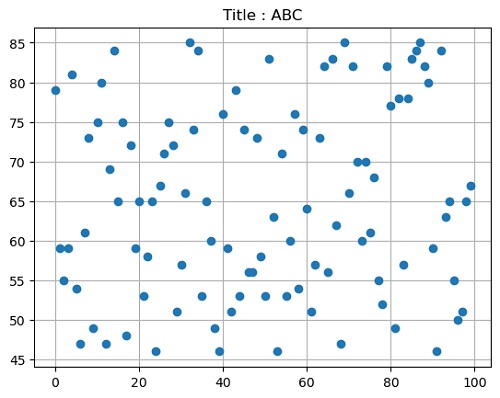
In this tutorial, we are going to explore all three locations for the title of a Figure using matplotlib inbuilt command loc= ['left', 'right', 'center'].
Illustration:
Python code for title locations in matplotlib
import numpy as np
import matplotlib.pyplot as plt

x = np.arange(100)
y = np.random.randint(45,86,100)

plt.figure()
plt.plot(x,y, 'o')
plt.title('Title : ABC', loc='left')
plt.grid()
plt.show()

plt.figure()
plt.plot(x,y, 'o')
plt.title('Title : ABC', loc='Right')
plt.grid()
plt.show()

plt.figure()
plt.plot(x,y, 'o')
plt.title('Title : ABC', loc='Center')
plt.grid()
plt.show()
Output:
Output is as figure
Advertisement
Advertisement