Home »
Python »
Python Data Visualization
Python | Varying Density of Bar Code
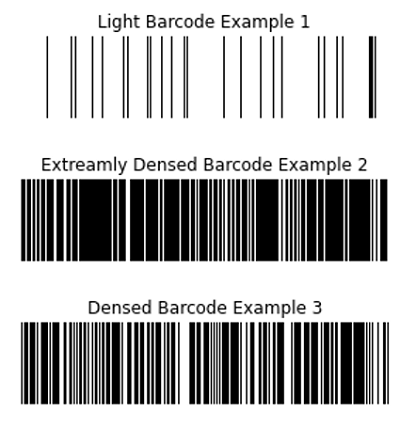
Varying Density of Bar Code: In this article, we are going to dense bar code in matplotlib.
Submitted by Anuj Singh, on August 27, 2020
Matplotlib allows us to vary the density of a bar graph and the following example shows lighter, densed, and extremely dense bar codes. This example can be used as a reference for the implementation of different bar codes.
Illustrations:
Python code for varying density of bar code
import matplotlib.pyplot as plt
import numpy as np

# the bar
x = np.random.rand(500) > 0.9

fig = plt.figure()

# a barcode
ax = fig.add_axes([0.3, 0.4, 0.6, 0.2])
ax.set_axis_off()
ax.imshow(x.reshape((1, -1)), aspect='auto',
          cmap='binary', interpolation='nearest')
ax.set_title('Light Barcode Example 1')
plt.show()

##########################################

x = np.random.rand(500) > 0.2

fig = plt.figure()

# a barcode
ax = fig.add_axes([0.3, 0.4, 0.6, 0.2])
ax.set_axis_off()
ax.imshow(x.reshape((1, -1)), aspect='auto',
          cmap='binary', interpolation='nearest')
ax.set_title('Extreamly Densed Barcode Example 2')
plt.show()

##########################################

x = np.random.rand(500) > 0.4

fig = plt.figure()

# a barcode
ax = fig.add_axes([0.3, 0.4, 0.6, 0.2])
ax.set_axis_off()
ax.imshow(x.reshape((1, -1)), aspect='auto',
          cmap='binary', interpolation='nearest')
ax.set_title('Densed Barcode Example 3')
plt.show()
Output:
Output is as Figure
Advertisement
Advertisement