Home »
Python »
Python Data Visualization
Python | Watermark in Figure using Class
Here, we are going to learn about the watermark in figure using class and its Python implementation.
Submitted by Anuj Singh, on July 19, 2020
Sometimes, we need to add watermark as a standard category of plots and therefore, we are introducing a new methodology for adding watermark in this article.
Python code for watermark in figure using class
# Data Visualization using Python
# WaterMark in Figure
import matplotlib.pyplot as plt
from matplotlib.figure import Figure
import numpy as np
class WatermarkFigure(Figure):
def __init__(self, *args, watermark=None, **kwargs):
super().__init__(*args, **kwargs)
if watermark is not None:
bbox = dict(boxstyle='square', lw=3, ec='gray',
fc=(0.9, 0.9, .9, .5), alpha=0.3)
self.text(0.5, 0.5, watermark,
ha='center', va='center',
fontsize=40, color='gray', alpha=0.3, bbox=bbox)
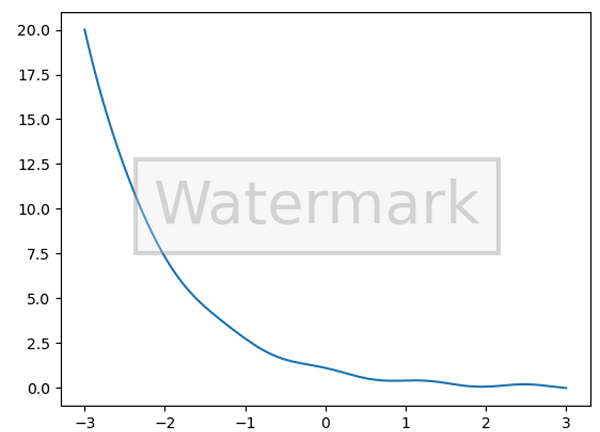
x = np.linspace(-3, 3, 201)
y = np.exp(-x) + 0.1 * np.cos(5 * x)
plt.figure(FigureClass=WatermarkFigure, watermark='Watermark')
plt.plot(x, y)
Output:
Output is as figure
Advertisement
Advertisement